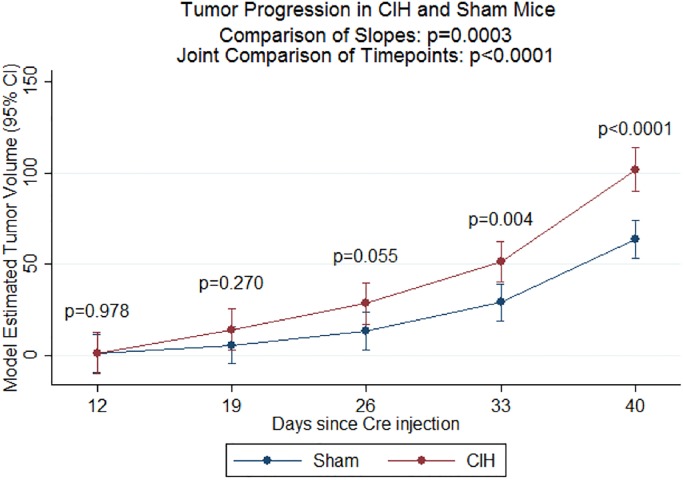
Fig 4. Tumor volume measured by micro CT scans.
Tumor volume and associated 95% confidence intervals estimated from linear mixed model analysis are shown. Data for individual mice are shown. We found a significantly faster increase in tumor volume in the CIH versus Sham groups (p = 0.0003) and significant differences between the two groups across all timepoints (overall p<0.0001). In pairwise comparisons at each individual timepoint, the CIH group had trending or significantly greater tumor volume at day 26 (p = 0.055), day 33 (p = 0.004) and day 40 (p<0.0001). Sample size is as follows: for CIH at Day 12 (n = 11), Day 19 (n = 11), Day 26 (n = 11), Day 33 (n = 11), Day 40 (n = 10); for Sham at Day 12 (n = 13), Day 19 (n = 13), Day 26 (n = 13), Day 33 (n = 13), Day 40 (n = 13).

