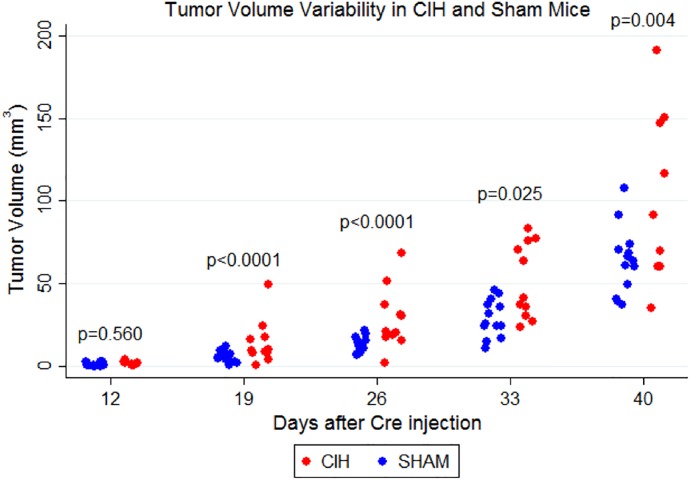
Fig 5. Variability in tumor volume as measured by micro CT scans.
The measured tumor volume within the CIH and Sham groups in each time point is demonstrated. We found significantly greater variability in tumor volumes for the CIH group compared to Sham at day 19 (p<0.0001), day 26 (p<0.0001), day 33 (p = 0.025) and day 40 (p = 0.004).

