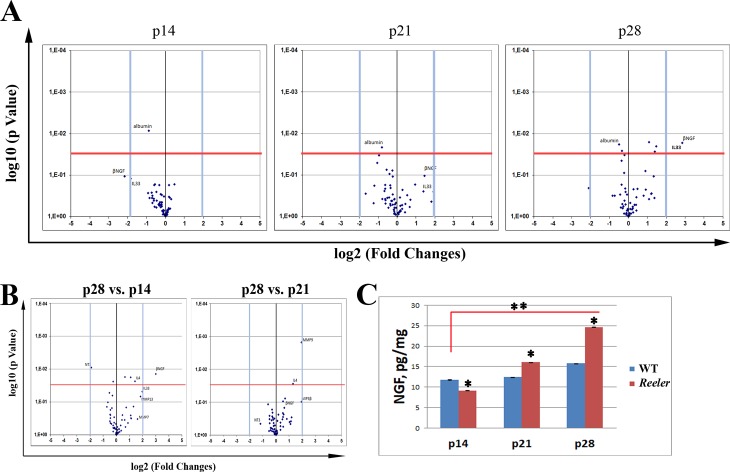
Fig 1. Time-dependent protein profile for Reeler vitreous (p14—p21—p28).
Proteins were extracted from not-pooled vitreous samples and subjected to protein array analysis, as described in MM section. (A) Volcano Plots representative for p14 (left), p21 (middle) and p28 (right) Reeler vitreous as compared to WT. (B) Volcano plot representative for p28 Reeler vitreous with respect to p14 (left) and p21 (right) Reeler. Data are log2 FC (Fluorescent Intensity) values as provided at the end of Genepix analysis. Fold changes (±2 FC) and pValues (p< 0.001) were used as initial cut-offs (two-sided unpaired t-test statistical comparisons). (C) As corroborated by NGF ELISA, note the time-dependent changes of NGF expression in Reeler extracts at p14, p21 and p28. Significant differences between subgroups are shown. (**p<0.01; ANOVA, mean±SEM and pg/mg for total protein; Reeler vs. WT).

