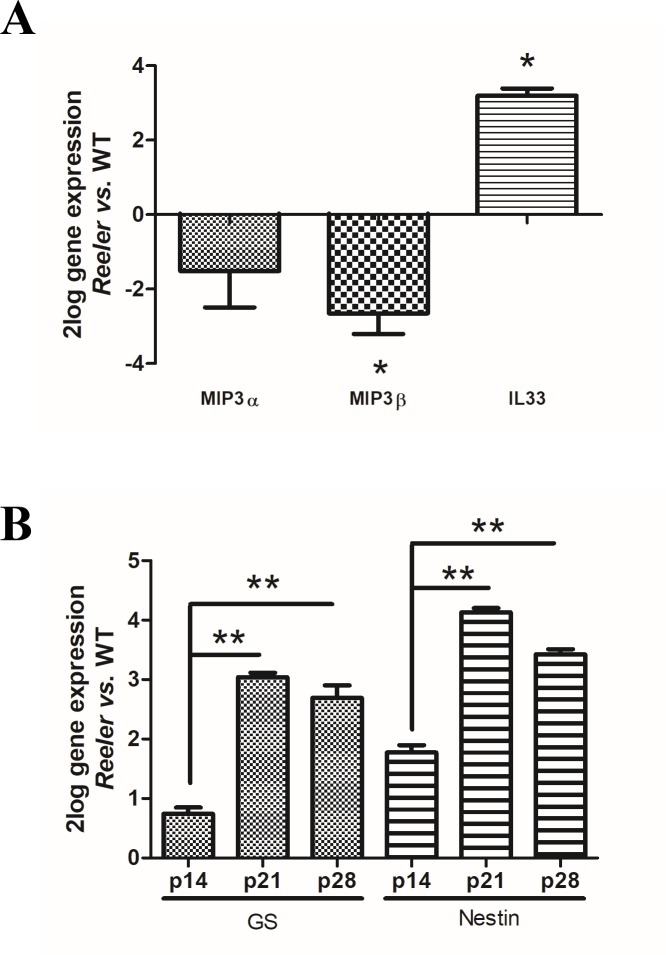
Fig 2. IL33, MIPs, Glutamine Synthetase (GS) and Nestin mRNA expression in Reeler retinas.
Total RNA was extracted from not pooled retinas and used to generate cDNA for real time PCR analysis. (A) Histogram showing a downregulation for MIP3α and MIP3β mRNAs and an upregulation for IL-33 mRNA in Reeler retinas, as compared to WT ones. (B) Histogram showing mRNA expression changes for GS and Nestin at all time-points investigated, representative of a local Müller activation. Significant differences between subgroups are shown as *p<0.05 and **p<0.01; ANOVA-REST coupled analysis). Data are 2log gene expression (mean±SEM, Reeler vs. WT).

