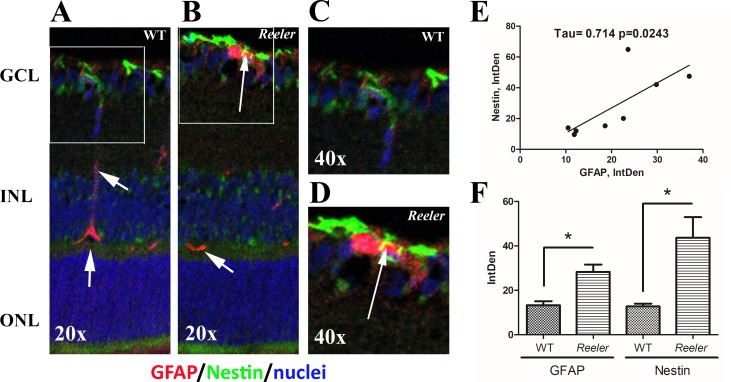
Fig 3. GFAP and Nestin immunoreactivity in retinal sections.
Epifluorescent acquisition of p28 Reeler and WT retinas. (A-D) As compared to WT, both GFAP (red) and Nestin (green) immunoreactivities were highly visible in Reeler retinas (AB, GCL). Arrows point at yellow immunoreactivity in the white frame (B) indicating GFAP and Nestin co-expression in cells having long-filaments (activated Müller cells), as compared to wild type (arrowheads in A). Magnifications are provided in D and C respectively. Nuclei were DAPI counterstained (blue). (E) Scatter plot showing a positive correlation between GFAP and Nestin IntDen values. Both tau and p values obtained with Kendall analysis are reported in the panel. (F) Histogram representative of GFAP and Nestin IntDen analysis (mean±SEM) in both Reeler and WT retinas. Note the increased values for Reeler with respect to WT (*p<0.05, ANOVA analysis). Abbreviations: GCL, Ganglion Cellular Layer; INL, Inner Nuclear Layer; ONL, Outer Nuclear Layer; IntDen, Integrated Optical Density. Magnifications: x200 (AB) and x400 (CD).

