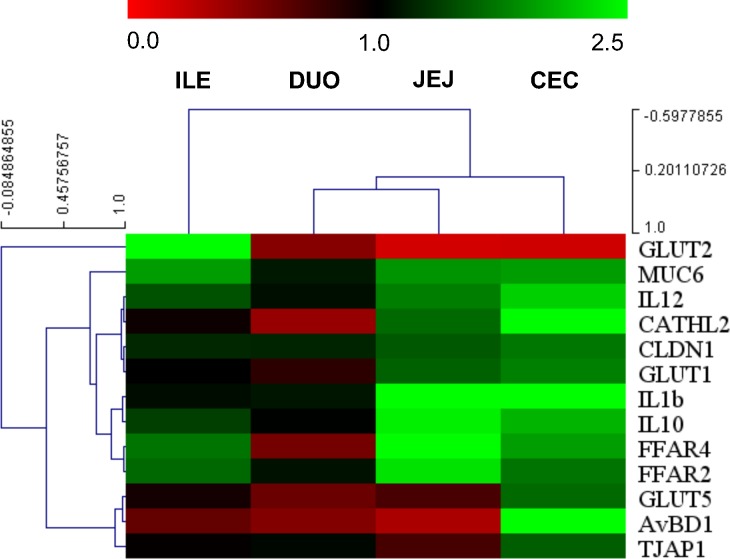
Fig 2. A heat map of hierarchically clustered gene expression in different segments of intestinal mucosa in chicken treated with GOS in ovo.
Intestinal segments: DUO–duodenum, JEJ–jejunum, ILE–ileum, and CEC–caecum. In ovo injection was carried out on day 12 of egg incubation. Intestinal samples (n = 10) collected from chickens on day 42 post-hatching. RT-qPCR data were generated with custom-designed primers used for amplification with SYBR green dye; Glucose-6-phosphate dehydrogenase (G6PDH) and beta-actin (ACTB) were used as reference genes; relative gene expression (fold change) calculated as 2–ΔΔCt. A Multiexperiment Viewer version 4.9 (MeV) was used for constructing a Hierarchical Cluster Tree based on fold change. Colours (red-black-green) show relative gene expression changes in GOS vs. C (red: down-regulated, green: up-regulated genes).

