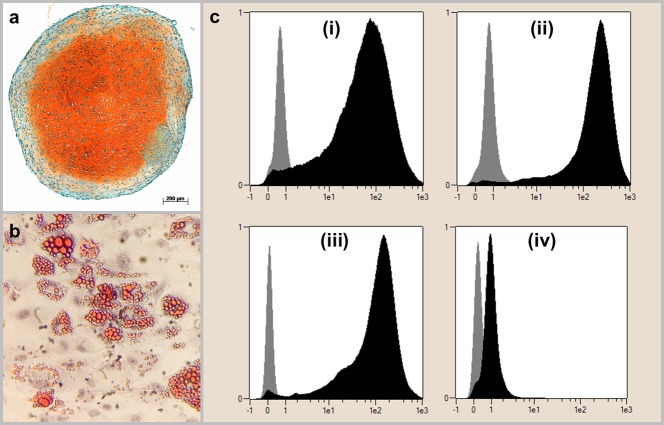
Fig 2. Definition of the cell population as MSC.
The cell populations were able to differentiate into chondrogenic lineage as demonstrated by the orange-colored extracellular chondrogenic matrix in Safranin O/Fast Green staining (a) and in adipogenic lineage, as shown by red-colored vacuoles in Oilred-O staining (b). Furthermore, the cells exhibit the MSC-specific surface characteristics (c): (i) corresponds to CD90, (ii) to CD105, (iii) to CD73 and (iv) to the negative control composed of CD14, CD20, CD34 and CD45. The gray bar in the left part of each graph shows the results of the isotype control being labeled with murine antibodies whilst the black bar on the right shows the results of human MSC being labeled with human antibodies. The x-axis shows the fluorescence intensity in logarithmic scale, the y-axis represents a height-normalized linear scale of cell number. Results are shown representatively for one donor.

