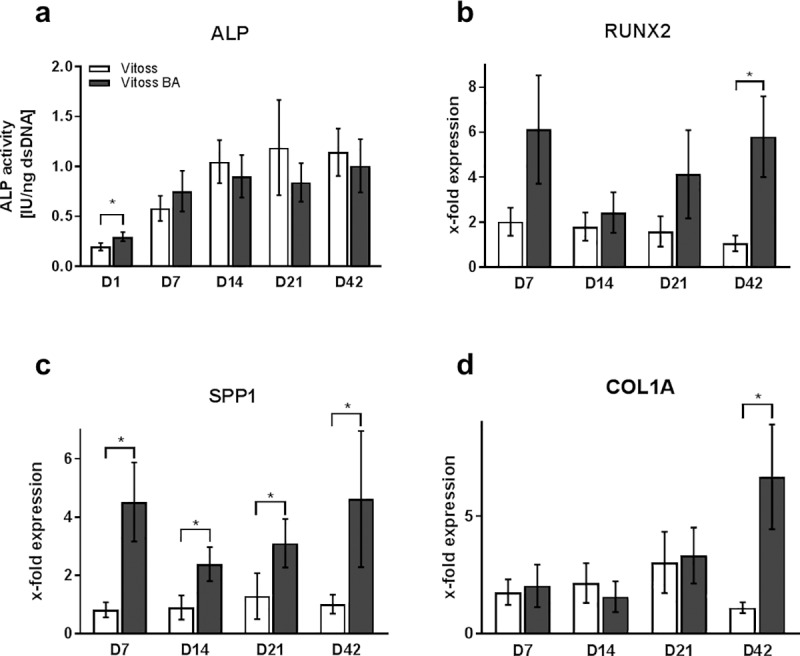
Fig 5. Correlates of osteogenic differentiation.

ALP activity (a) and quantitative gene expression of RUNX2 (b), SPP1 (c), and COL1A (d) during the incubation time (D1-D42). Since ALP activity was significantly higher at any observation point for D7, D14, D21, and D42 when compared to D1 in both groups, significances are not indicated in the figure for reasons of clarity. Gene expression was normalized to gene expression on D1 and is therefore shown as x-fold expression. Values are shown as means with standard error of the mean. (*) indicates significant differences.
