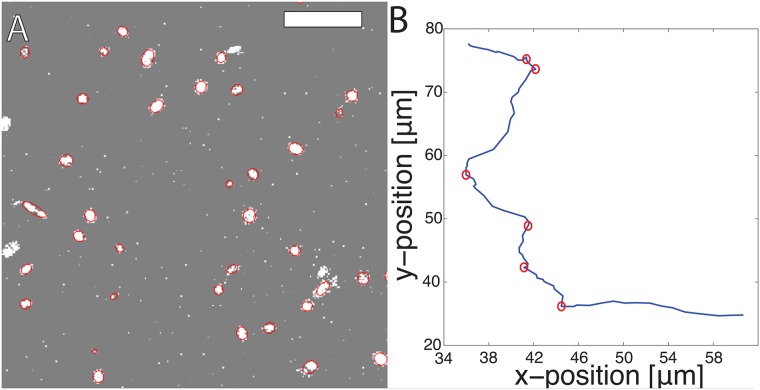
Fig 1. Experimental cell environment with typical trajectory.
(A) An example image of nuclei stained with Hoescht dye. The scale bar is 500 μm. These images were processed using the ACTIVE image analysis package to track nuclei centers-of-mass [27], with overlaid best-fit ellipses. (B) A typical cell trajectory with tumbling events indicated by red circles, as identified by the 2D Canny edge detection algorithm.

