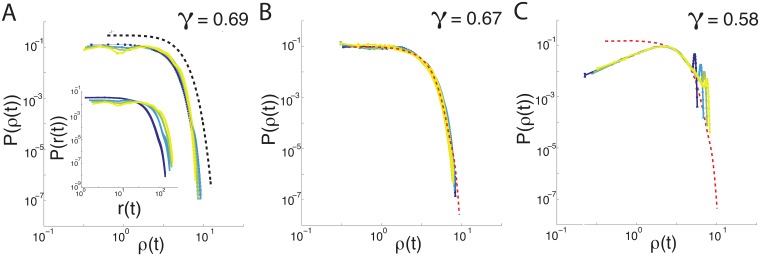
Fig 3. Displacement probability distributions collapse at similar scaling exponents.
Displacement probability distribution P(ρ), where ρ(t) is the scaled displacement , for the value of γ that best collapses the data, for (A) Mouse fibroblast cells, (B) generalized SPP model and (C) Lévy walk, with colors representing 4 binned timescales from blue (small) to yellow (large) at times t = 5, 10, 15 and 20 hours. Mouse fibroblast is shown as a dashed red line in (B, C) for comparison with each model, showing that only the generalized SPP model is consistent with the observed data. Collapsed mouse fibroblast distributions are fit to a Gaussian (A) shown as a dashed black line, artificially shifted for visibility. See Fig 4 for a characterization of different γ values for each model, characterized by χ2.

