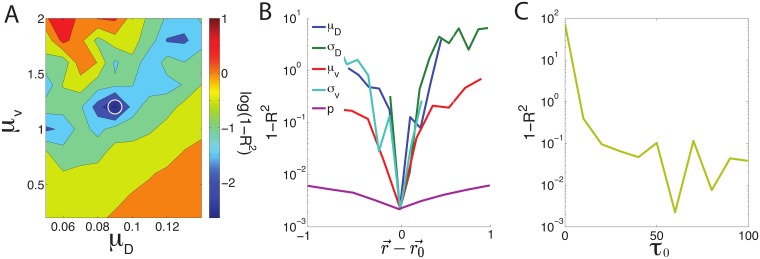
Fig 6. Model sensitivity calculated through exploring phase space.
Sensitivity analysis examining the goodness of fit of the generalized SPP model to displacement distributions in mouse fibroblasts (1 − R2) as a function of model parameters. (A) Contour plot of log(1 − R2) illustrates the experimental data tightly constrains a linear combination of the mean velocity μv and mean noise μD, where the minima is highlighted by a white circle. (B, C) The goodness of fit as a function of each model parameter while all others are held fixed. (B) is the optimal coordinate in parameter space and is the distance of each parameter from its optimal value. (C) A value of τ smaller than ≈ 10 is inconsistent with experimental data, but data does not discriminate between larger values of τ.

