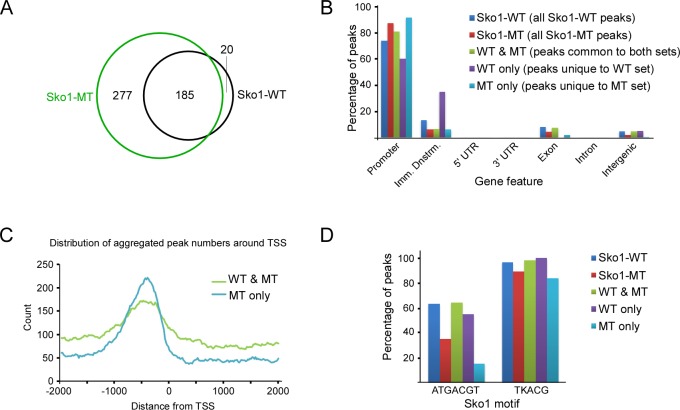
Fig 4. Sko1-MT binds dramatically more promoter regions than Sko1-WT.
(A) Venn diagram showing number of common and unique peaks from the untreated Sko1-WT and Sko1-MT ChIP-seq analyses. Peaks identified in both ChIP-seq replicates (i.e. overlapping peak sets) were examined. (B) Distribution of ChIP-seq peaks from untreated Sko1-WT and Sko1-MT samples across indicated gene features. “Imm. Dnstrm.” refers to the 1000 bases immediately downstream of the 3ʹ UTR-encoding sequence. “WT & MT” refers to peaks shared between the Sko1-WT and Sko1-MT sets, whereas “WT only” and “MT only” refer to peaks that are unique to the respective peak sets. (C) Distribution of aggregate peak numbers around the nearest transcriptional start site (TSS) for “WT & MT” and “MT only” peak sets. (D) Percentage of peaks, within indicated peak sets, that contain the major Sko1 consensus motif, ATGACGT, or a less-specific motif, TKACG, where K is G or T.

