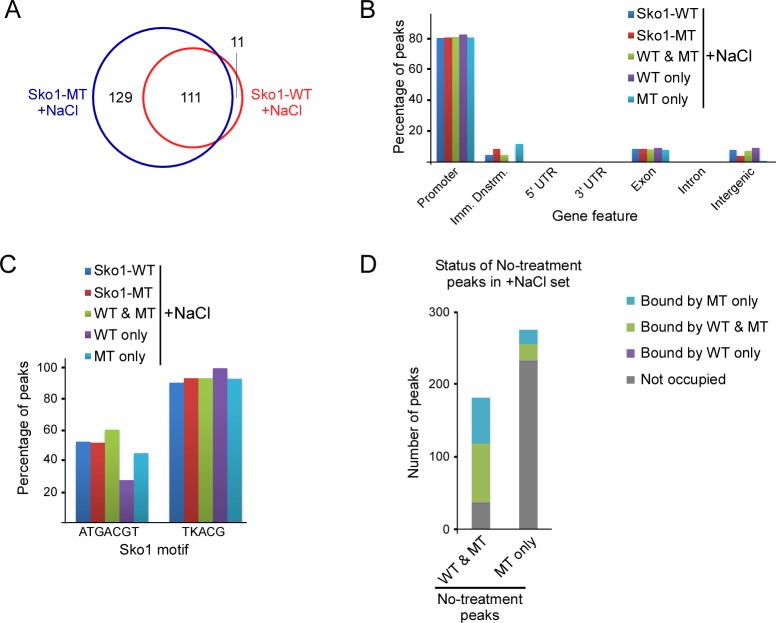
Fig 5. Sko1-MT binds more promoter regions than Sko1-WT after treatment with NaCl.
(A) Venn diagram showing number of common and unique peaks from the NaCl-treated Sko1-WT and Sko1-MT ChIP-seq analysis. Peaks identified in both ChIP-seq replicates (overlapping peak sets) were examined. (B) Distribution of ChIP-seq peaks from NaCl-treated Sko1-WT and Sko1-MT samples across indicated gene features, as in Fig 4B. (C) Percentage of peaks, within indicated peak sets, that contain the major Sko1 consensus motif, ATGACGT, or a less-specific motif, TKACG, where K is G or T. (D) Status of “WT & MT” and “MT only” Sko1 binding sites from ChIP-seq analysis of untreated samples in the NaCl-treated set.

