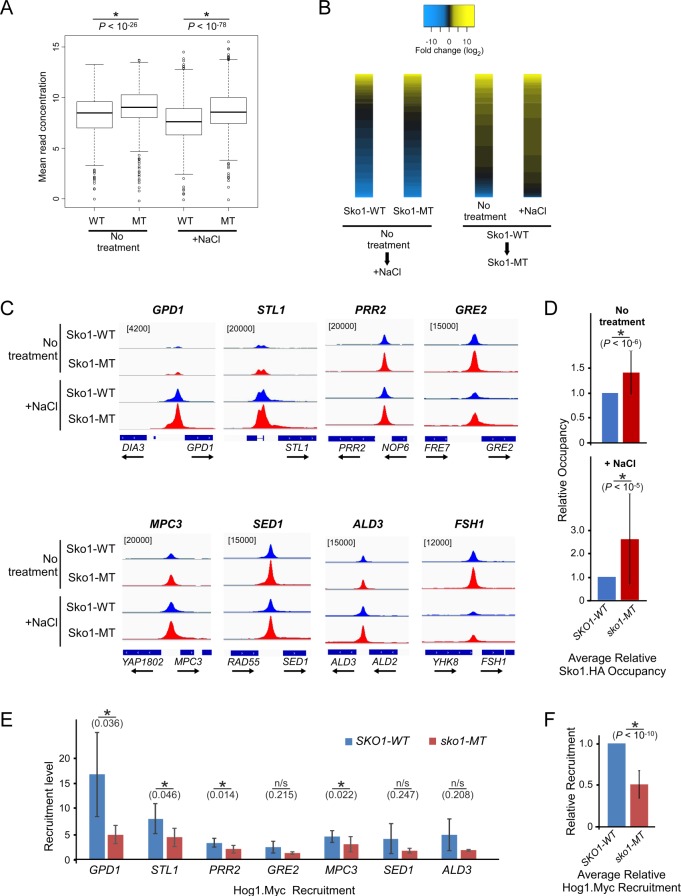
Fig 6. Differential binding analysis indicates that Sko1-MT has higher occupancy levels than Sko1-WT.
(A) Boxplots comparing mean read concentrations (log2 normalized ChIP read counts) for the 630 consensus peaks in each of the four indicated ChIP-seq analyses. (B) At left, heatmap of differential binding analysis showing changes in occupancy levels (fold change; log2) in Sko1-WT or Sko1-MT after treatment with NaCl, for the 630 consensus peaks. Yellow indicates increased binding after NaCl, whereas blue indicates reduced binding. At right, heatmap of differential binding analysis comparing occupancy levels in Sko1-WT with Sko1-MT in untreated or NaCl-treated samples, at the 630 consensus peaks. Yellow indicates higher occupancy levels for Sko1-MT, whereas blue indicates higher occupancy for Sko1-WT. In all cases, black indicates no significant difference in occupancy level. Each heatmap is independently sorted by magnitude of occupancy level difference. (C) Sko1 occupancy peaks were aligned to the yeast genome and eight representative peak alignments are shown for the four samples analyzed from Replicate 1, as plotted using the Integrative Genomics Viewer (IGV). Numbers in square brackets refer to maximum data range (of sequence reads) for the tracks in each column. (D) Validation of ChIP-seq was performed at eight genes by qPCR analysis of five independent ChIP experiments (as summarized in S4B Fig). The average occupancy of Sko1-MT, relative to Sko1-WT occupancy, across all tested genes and replicates, is shown, in untreated samples (top), and in samples treated with 0.4 M NaCl for 5 min (bottom). Error bars represent standard deviation. (E) Recruitment level of Hog1.Myc, as determined by ChIP analysis (see S6 Fig), at indicated promoter regions in SKO1-WT and sko1-MT strains. Recruitment level was calculated as the ratio of occupancy at 5 min to occupancy at 0 min after treatment with NaCl. Error bars represent standard deviation of three independent replicates. (F) Average Hog1.Myc recruitment level in sko1-MT relative to its level in SKO1-WT. The level of Hog1.Myc recruitment in sko1-MT, calculated relative to recruitment in SKO1-WT, was averaged across all seven Hog1 target genes tested by ChIP-qPCR (panel (E) and S6 Fig). Error bars represent standard deviation for three replicates across all seven genes. P-values from Student’s t-test analysis are indicated. Asterisks (*) indicate that the compared data pairs are statistically different (P < 0.05; see Materials and Methods).

