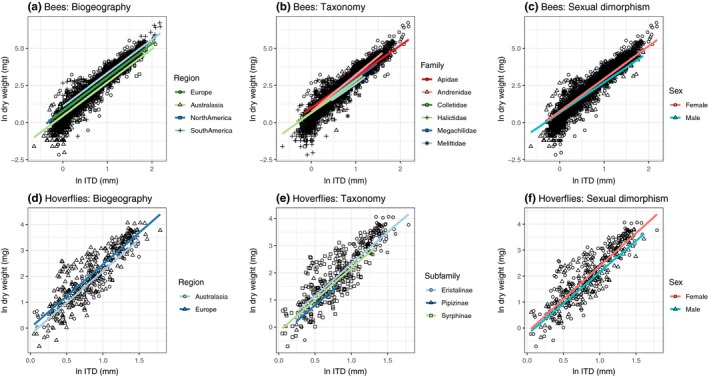
Figure 2.

Dry weight (mg) ~ Intertegular distance (ITD) interspecific relationships. From left to right: influence of biogeographic region, taxonomic grouping, and sexual dimorphism. Lines represent the posterior fits from Bayesian generalized linear mixed models. Credible intervals are omitted for clarity. See Supporting Information Appendix S1 for model parameters
