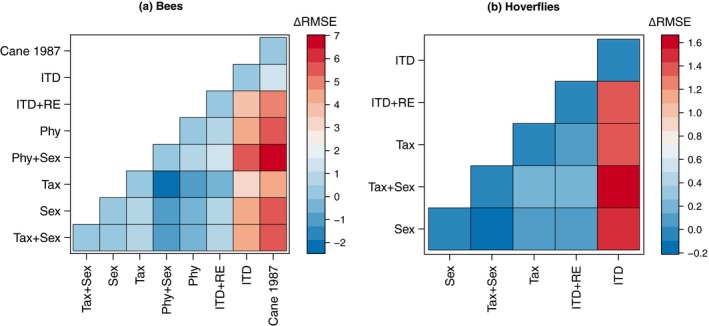
Figure 3.

Pairwise comparisons of Δ root‐mean‐square error (RMSE) in milligrams between bee and hoverfly models. Blue values denote marginal precision differences in models, whereas red values indicate more error in models in the rows relative to the columns. Tax + Sex: Full taxonomic model, Tax: Reduced taxonomic model, Sex: Sexual dimorphic model, Phy + Sex: Full phylogenetic model, Phy: Reduced phylogenetic model, ITD + RE: ITD mixed effect model, ITD: ITD fixed effect model. Cane 1987: Cane (1987)'s)’s original model for bees
