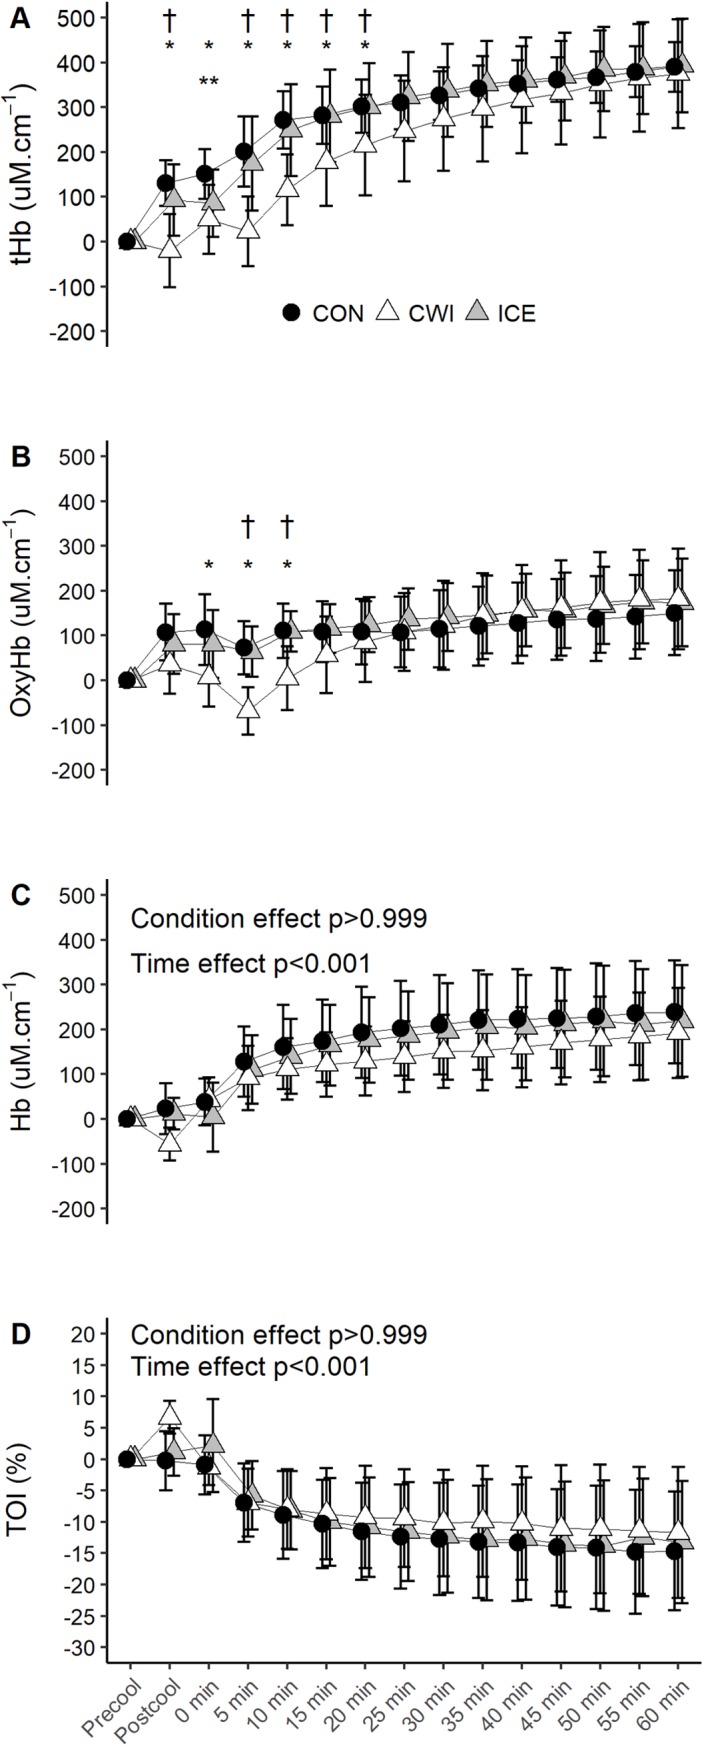
Fig 2.

Changes in tHb (A), HbO2 (B), Hb (C) and TOI (D) during 60 min of cycling at fixed intensity (study 1). CON, control; CWI, cold water immersion; ICE, ice slushy ingestion; * p<0.05 CWI versus CON; ** p<0.05 ICE versus CON; † p<0.05 CWI versus ICE. Data are expressed as absolute changes from the baseline values and are mean ± SD for n = 11, except for the final 20 min of exercise during CON and the final 10 min of exercise during ICE where n = 10 due to probe damage.
