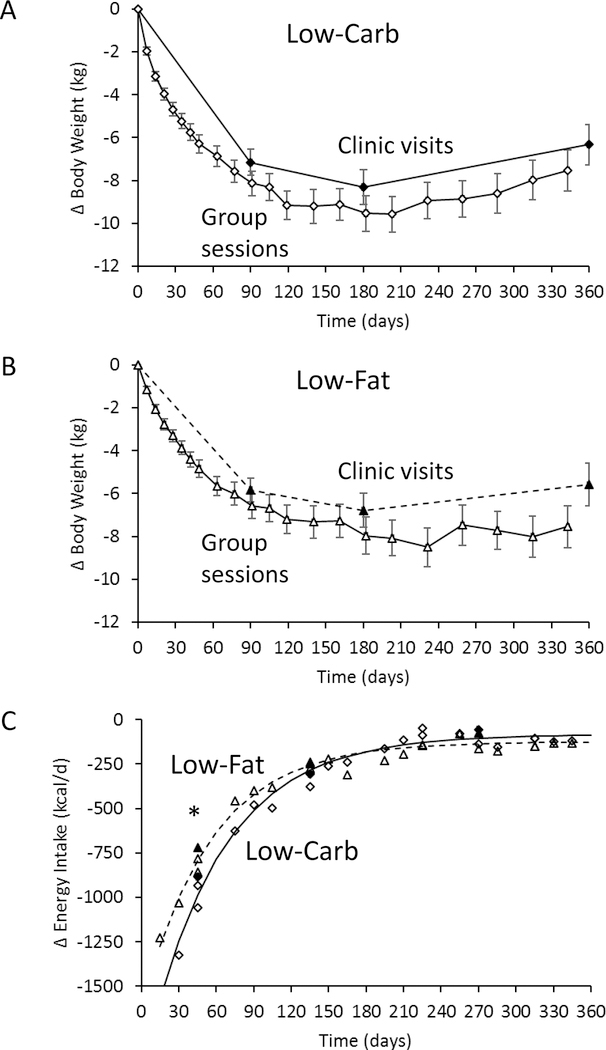
Figure 2.
A) Mean body weight changes for the 209 subjects in the low-carbohydrate diet group (♦ clinic and ◊ self-reported) and B) the 205 subjects in the low-fat (▲clinic and Δ self-reported) diet group. C) Mean model-based measurements of energy intake changes in the low-carbohydrate diet group (▲ from clinic weights and Δ from self-reported weights ) and the low-fat diet group (◊ from self-reported weights and ♦ from clinic weights) both followed an exponential time courses (solid curve and dashed curve for low-carbohydrate and low-fat diets, respectively). * indicates p<0.05 between diet groups and the error bars indicate 95% CI.

