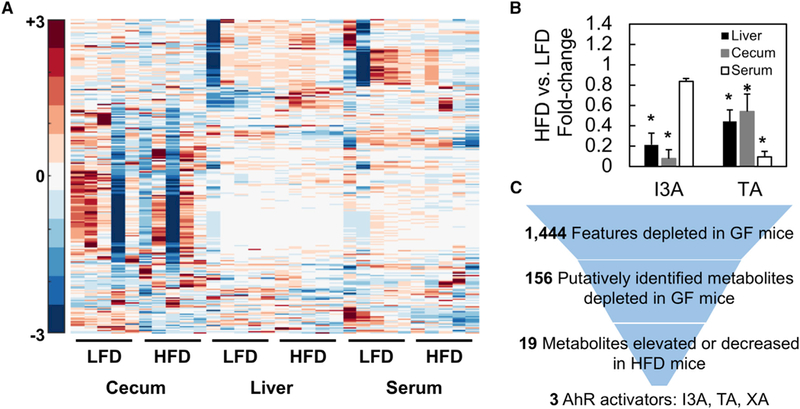
Figure 2. Liver, Cecum, and Serum Samples from LFD- and HFD-Fed CONV-R Mice (Male C57BL/6J) Were Analyzed Using Untargeted LC/MS-MS Experiments.

(A) Significantly different features were Pareto scaled and clustered along with features of interest based on annotation of GF and CONV-R samples.
(B) TA and I3A were quantified using targeted analysis to confirm depletion of these metabolites in HFD samples. Metabolite levels were normalized to sample weights and plotted as fold changes comparing HFD to LFD.
(C) Data shown are averages of n = 5 mice. Error bars represent 1 SD. *p < 0.05. Metabolite selection process based on features differentially present in GF versus CONV-R samples and HFD versus LFD samples. Final selections are suspected AhR ligands.
