
Figure 3. Comparison of Free Fatty Acid (FFA) Profiles in HFD and LFD Mice.
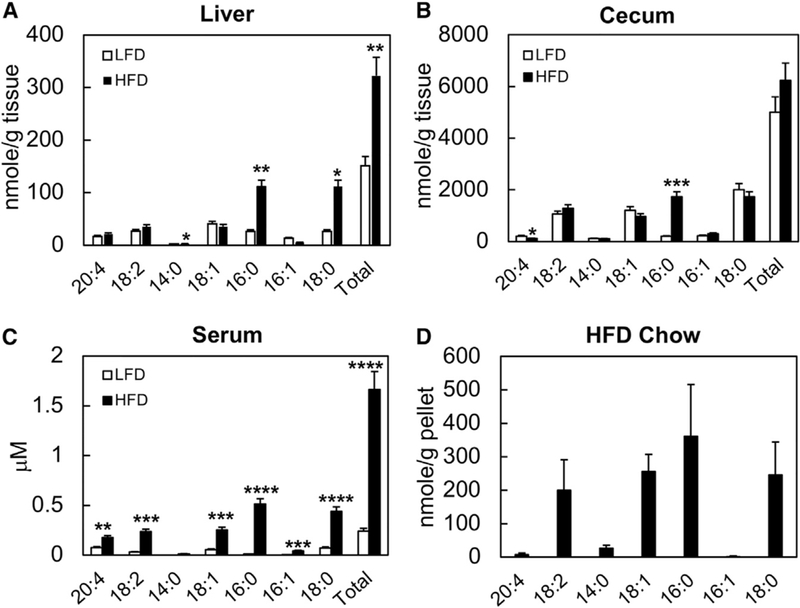
(A–C) Major FFA species were quantified in liver (A), cecal luminal content (B), and serum (C) samples from HFD- and LFD-fed mice.
(D) The same FFAs were quantified in the HFD pellets (D).
Data shown are averages of n = 5 mice. Error bars represent 1 SD. *p < 0.05, **p < 0.01, ***p < 0.001, ***p < 0.0005.