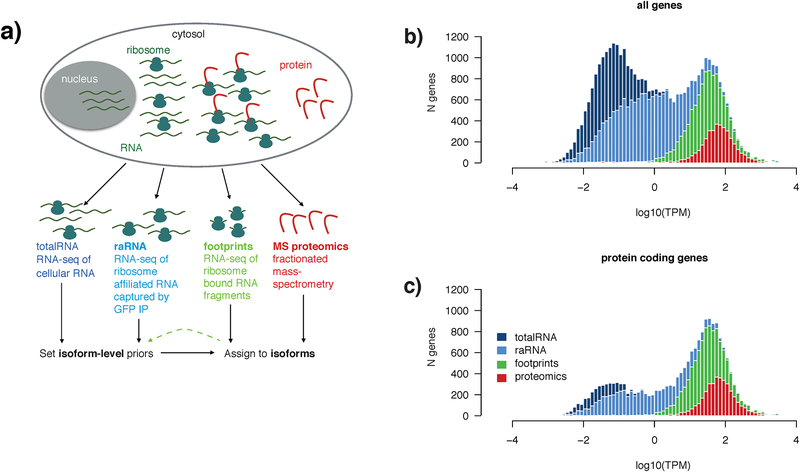
Figure 1 |. Experimental approach to integrated analysis of the transcriptome, translatome, and proteome.
a) Schematic diagram of the experimental approach to multi-modal profiling of the translatome in HEK293-L10a cells. Total-RNA and protein were obtained from lysing whole cells, while ribosome-associated (raRNA) and ribosome footprint RNA were obtained following immunoprecipitation of intact ribosomes from detergent extracted post nuclear supernatant (capturing cytosolic and ER associated ribosomes).
b) RNA-seq of totalRNA (dark blue) captures 60,155 genes (#genes, y-axis) that vary widely in abundance (log10(TPM), x-axis) and biotype. Gene location on the x-axis is defined by the TPM of the total-RNA for that gene, and as such all data shown is a subset of the genes observed by totalRNA. Plotted are genes (note that histograms are overlaid) also observed when profiling raRNA (light blue, 27,977 genes), ribosome footprints (green, lower threshold of 5 ribosome footprints/gene, 11,286 genes), and protein (red, genes with at least 2 peptides, 3833). The bimodal distribution of totalRNA gene expression broadly reflected a distinction between the cohort of mostly low-abundance non-coding RNAs and the higher-expressed protein-coding transcriptome. Genes with TPM > 1 show identical distributions of totalRNA-seq and raRNA-seq gene expression. Genes with at least five ribosome footprints are generally expressed above ~1 transcript per million (TPM). Fractionated LC-MS/MS, where peptides are first separated into pools offline, then analyzed serially, was used to identify proteins.
c) Of the 60,155 total genes captured by total RNA, 19,881 are annotated as protein coding. Ribosome footprints are identified from 56.2% of these protein coding genes, and proteomics samples 18.7%.

