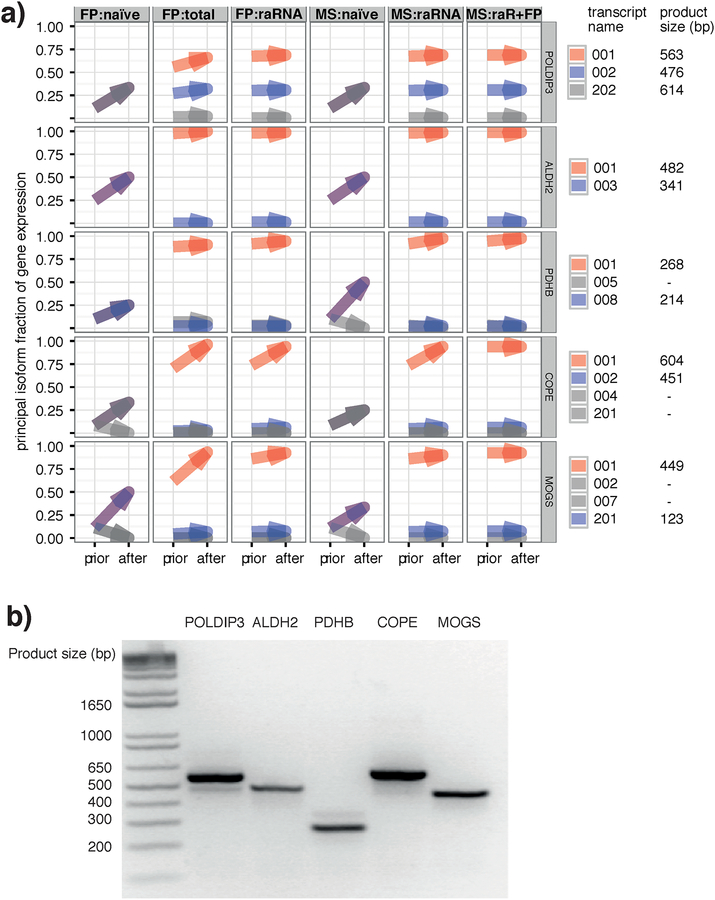
Figure 5 |. An RNA-seq prior improves isoform assignment in specific genes where a naive prior ties.
a) Detailed illustration of the EM result for 5 selected genes showing differences in the relative isoform abundances of each. In all cases, the biological prior was necessary to resolve the principal isoform (red) and the second isoform (blue) where applicable. To the right, the isoform names are shown along with the expected product size for the PCR validation in b)
b) PCR analysis of the 5 genes selected in panel a) show that, at least at the mRNA level, all agree with the principal isoform inferred by RNA-seq. POLDIP3 (left) also showed evidence for the expression of the second isoform predicted by RNA-seq.

