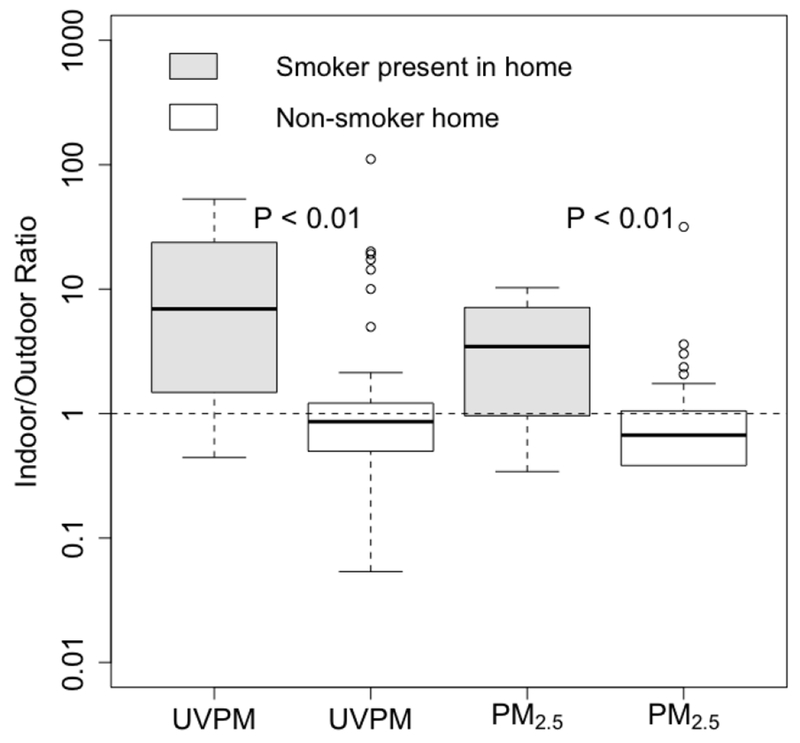
Figure 2:

Indoor/outdoor ratios of UVPM and PM2.5 stratified by presence of smoker in the residence. P-values obtained from Tukey’s HSD test (controlling for repeated measures). From below, horizontal line in boxplot represents minimum (excluding outliers), 25th, 50th, 75th percentiles and maximum (excluding outliers); Circles = outliers. Smoker home (n=12) = a home where at least one occupant smokes at least one cigarette per day, non-smoker home (n=59) = a home where no occupant smoked.
