
Figure 4:
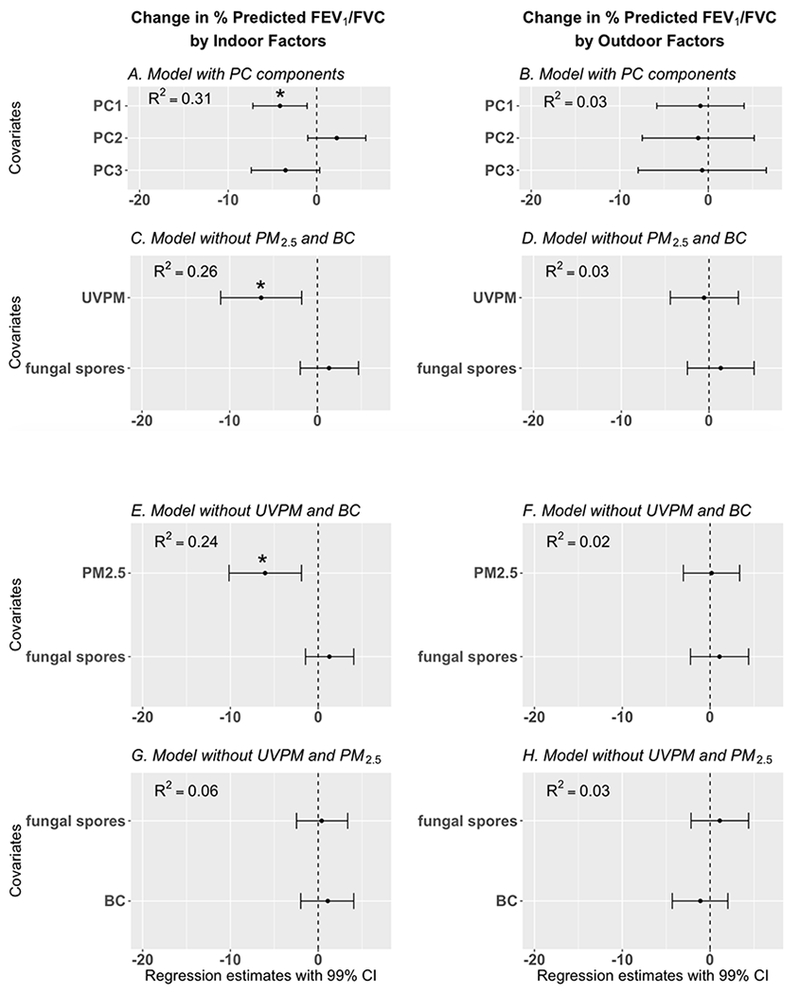
Results of regression models developed to explore the association between 48-hour measurements of particulate matter (indoor and outdoor simultaneously) and percent predicted FEV1/FVC ratio (adjusted for age, height, gender, and race).
Dots= regression estimates; error bars = 99% CI = 99% confidence interval of regression estimate (adjusted for presence/absence of pets and family income).
* indicates statistically significant finding, BC = black carbon, UVPM = ultraviolet light absorbing particulate matter, PC components = principal components of BC, UVPM, PM2.5 and fungal spores. In Figures 4C – 4H, one standard deviation increase in BC, UVPM, PM2.5, and fungal spores are associated with the corresponding regression estimates in the Figures. Four different models are presented to avoid multicollinearity of UVPM, BC, and PM2.5.