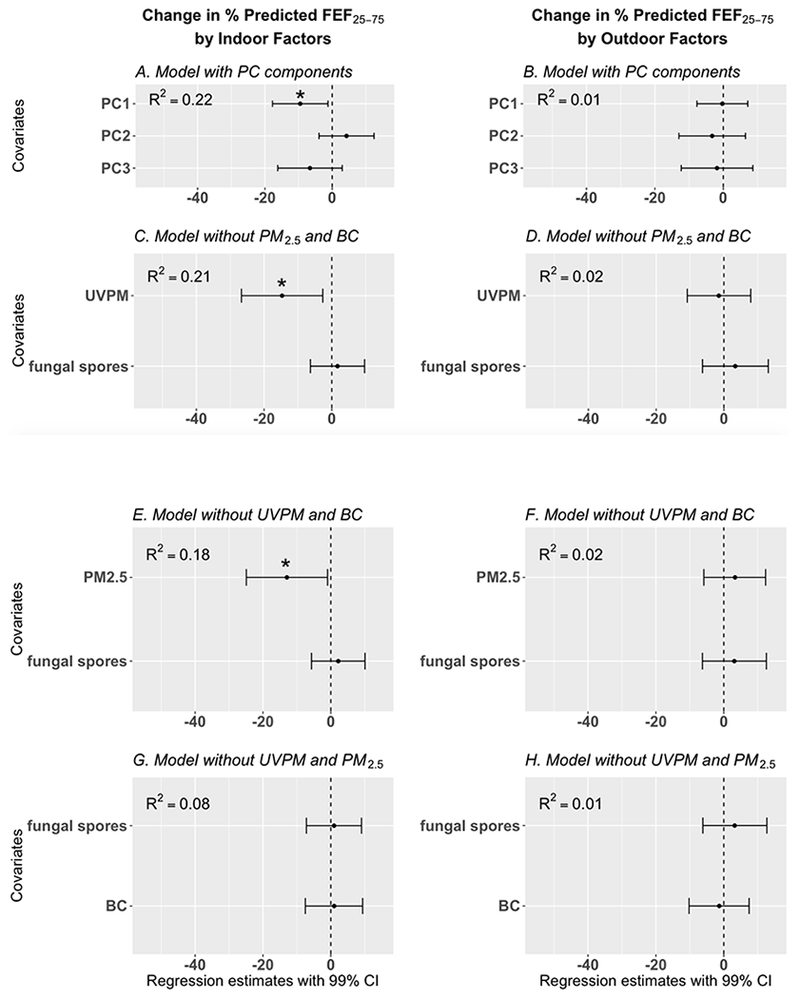
Figure 5:

Results of regression models developed to explore the association between 48-hour measurements of particulate matter (indoor and outdoor) and percent predicted forced expiratory flow between 25 – 75% of the forced vital capacity (FEF25-75) [adjusted for age, height, gender, and race], regression estimates are adjusted for adjusted for presence/absence of pets and family income. In Figures 5C – 5H, one standard deviation increase in BC, UVPM, PM2.5, and fungal spores are associated with the corresponding regression estimates in the Figures. See Figure 4 footnotes for additional figure descriptions.
