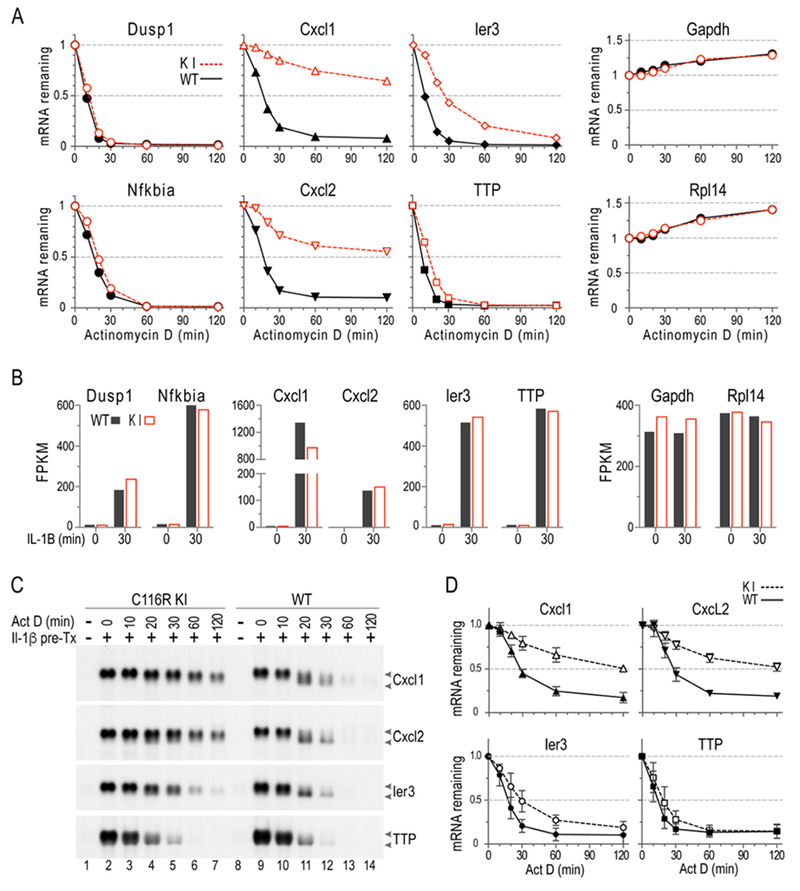
Fig. 1. mRNA decay in MEF.

MEF were pretreated with IL-1α (10 ng/ml) for 30 min, followed by addition of ActD; samples were then harvested at the indicated times. Northern blots were hybridized to Cxcl1, Cxcl2, Ier3, or TTP cDNA probes. (A) Decay curves are shown of RNAseq data, using a subset of the same RNA samples used in B. Each point represents the average of three biological replicates, in all cases shown as a fraction of the initial sample. (B) Shows northern blots from a representative experiment. The mRNA migration positions are indicated by arrows, with the upper arrow pointed to the fully polyadenylated species, and the lower arrow pointing to the deadenylated species. (C) Decay curves are shown, with means plotted as fractions of the original mRNA levels (mean ± SD). These data are from northern blots of the type shown in B, and the data represent probe-bound mRNA volumes generated from three independent experiments like the one shown in (B), using 3 pairs of WT and C116R littermates. (A) and (B) are adopted from [14], with permission.
