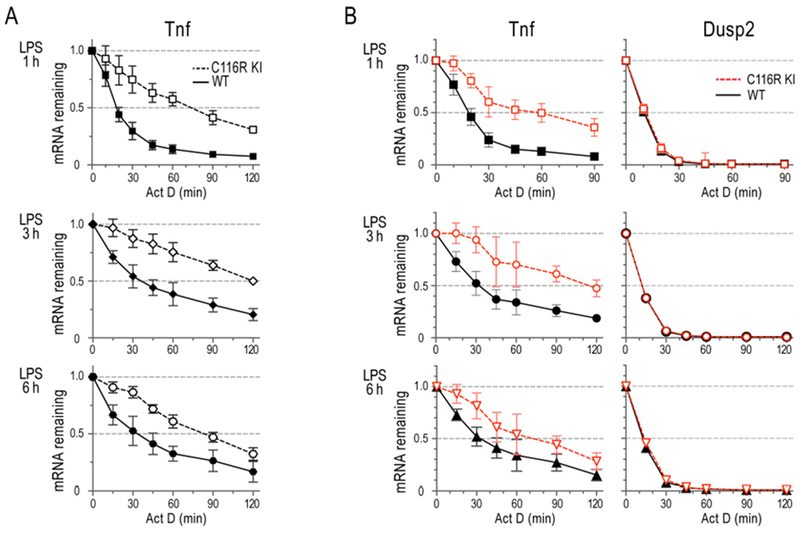
Fig. 2. mRNA decay in BMDM.

BMDM were pretreated with LPS (1 μg/ml) for 1 h, 3h, or 6h, as indicated to the left of the graphs, followed by incubation with ActD for the times indicated. Data are shown as fractions of the original mRNA levels (mean ± SD). (A) TNF decay curves shown are from data of northern blotting probe-bound mRNA volumes generated from five independent experiments, using five pairs of WT and C116R BMDM. (B) Decay curves shown are from NanoString data, using four sets of RNA samples similar to those used in (A). Adopted from [14], with permission.
