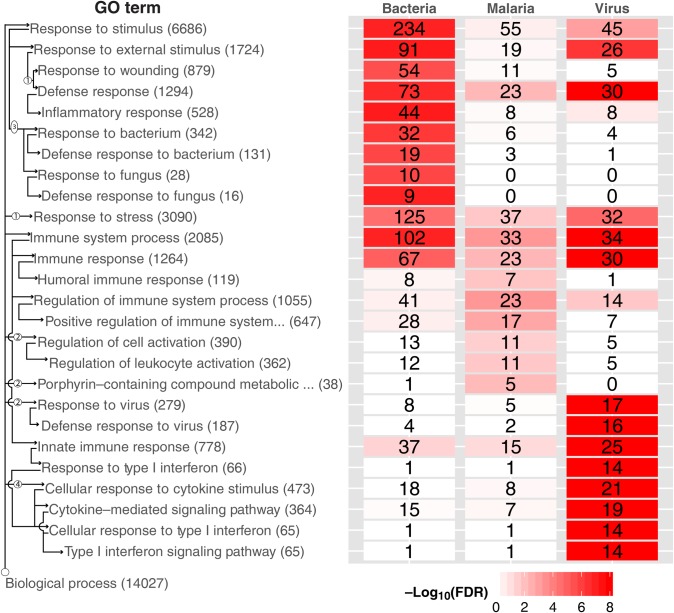
Figure 4.
Gene ontologic (GO) term enrichment heat map, displaying GO enrichment results using genes selected by cross-validation. The top 10 GO terms are shown by diagnostic category (regardless of significance), for a total of 26 terms across diagnostic categories. Four terms were represented in both bacterial and viral categories. Note that the bacterial and viral signatures top 10 GO terms were highly significant (by false discovery rate [FDR]), whereas the malaria signature was less significant. The top GO terms for malaria are all represented in the viral and bacterial GO term lists (just further down the list), suggesting that the malaria classification is at the exclusion of viral and bacterial classification. The total numbers of genes for each GO term are displayed in parentheses next to the title; the number of significant genes from each etiology for each term is displayed in each cell. Cells are colored by FDR. We illustrate the GO hierarchy via wiring diagram across the left side. Arrows indicate a “parent of” relationship, circled numbers indicate nodes not shown. For instance, there are 2 nodes between “Biological process” and “Response to virus”; the latter contains 279 genes total, of which 17 were found significant in viral samples, and is a parent of “Defense response to virus.”

