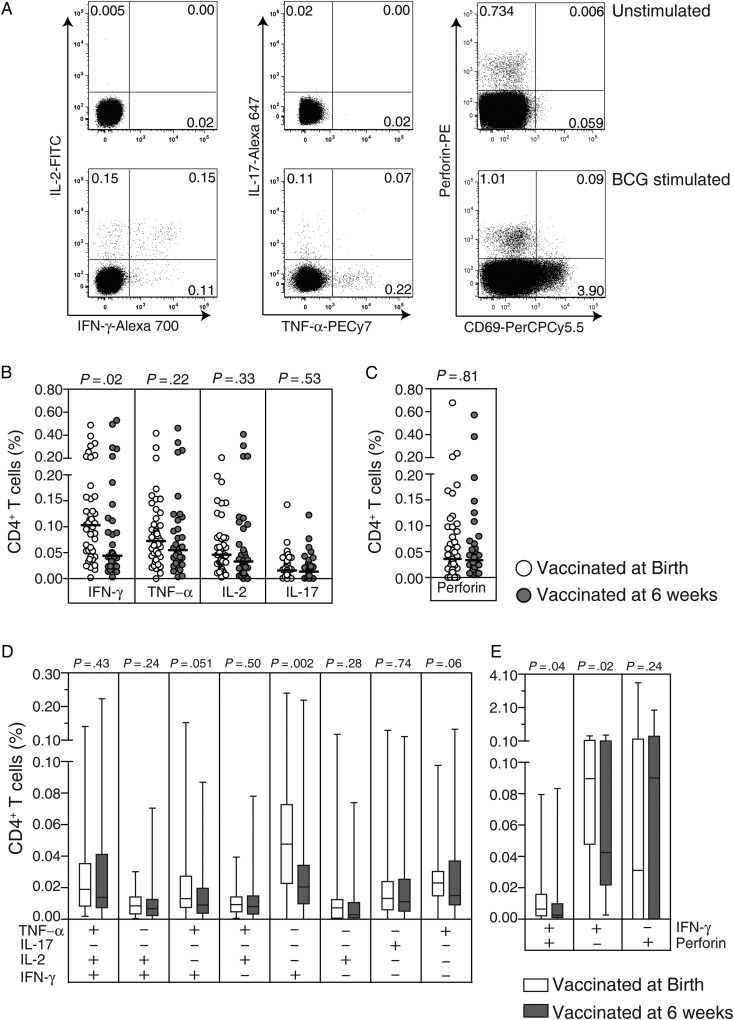
Figure 1.
Specific CD4+ T-cell cytokine and perforin responses measured in the short-term whole-blood assay. Representative flow cytometry data of cytokine and perforin expression in a negative control (unstimulated) sample (top row) or BCG-stimulated sample (bottom row) from a 9-month-old infant who received BCG vaccine at birth (A). Scatterplots depict frequencies of total: interferon γ (IFN-γ)–, tumor necrosis factor α (TNF-α)–, interleukin 2 (IL-2)–, and interleukin 17 (IL-17)–expressing CD4+ T cells (B) and perforin-expressing CD69+CD4+ T cells (C). In the scatterplots, the horizontal lines represent the median frequencies. Box and whisker plots show the frequencies of distinct subsets of specific CD4+ T cells based on combinations of expression of IFN-γ, TNF-α, IL-2, and IL-17 (D) and the frequencies of CD69+CD4+ T cells expressing IFN-γ and perforin singly or in combination (E). For box and whiskers plots, the horizontal line represents the median, the boxes represent the interquartile range, and the whiskers represent the 10th and 90th percentiles. Values shown are corrected for background responses in the negative control condition. The Mann–Whitney U test was used to assess differences in frequencies of cytokine- or perforin-expressing CD4+ T cells between infants vaccinated at birth (open dots/bars) and 6 weeks of age (closed dots/bars).

