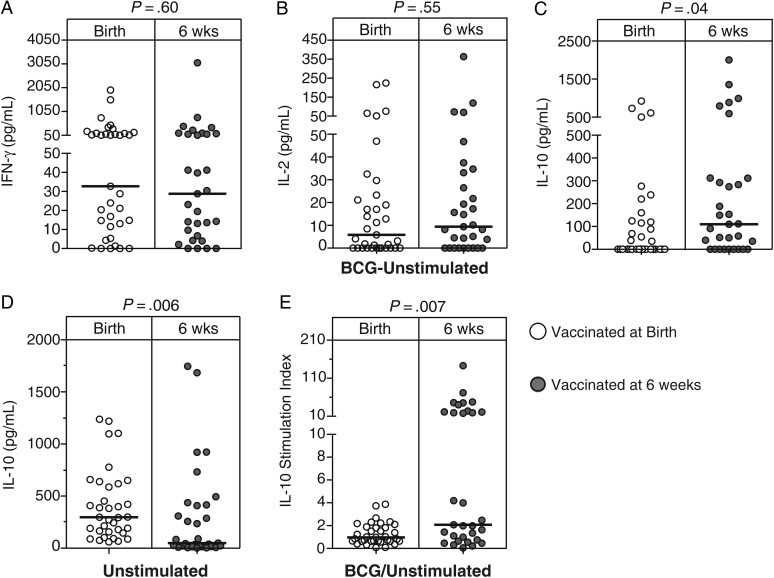
Figure 4.
BCG-specific cytokine levels in plasma. The scatterplots show levels of 3 different cytokines measured by multiplex bead array in plasma collected after whole blood was incubated with BCG for 7 hours. The following cytokines are shown: interferon γ (IFN-γ; A), interferon 2 (IL-2; B), and interleukin 10 (IL-10; C). All values are corrected for unstimulated levels (BCG-unstimulated) implies the response detected in the unstimulated sample was subtracted from that of the stimulated sample. IL-10 levels of the unstimulated samples and the ratio of stimulated divided by unstimulated IL-10 levels are shown in panels D and E, respectively. The horizontal lines represent the median frequencies. The Mann–Whitney U test was used to assess for differences between the cytokine levels in the 2 groups.

