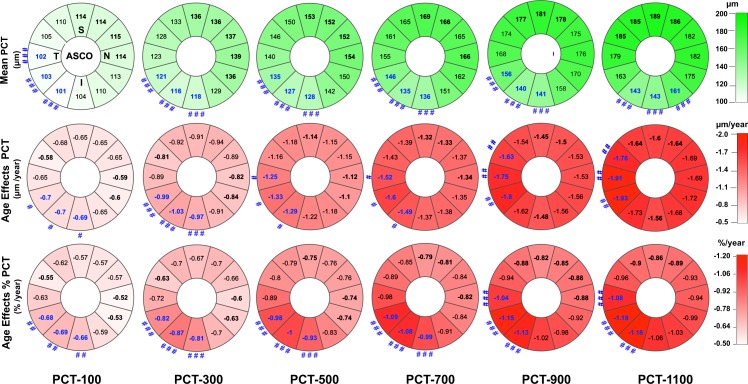
Figure 7.
FoBMO sectoral mean PCT (upper row), age-related PCT change (middle row), and age-related percent PCT change (%PCT, lower row) at six proximal (PCT-100 μm) to distal (PCT-1100 μm) locations from the ASCO. Data are presented in right eye orientation (upper left) by 30° (clock-hour) sectors that are oriented relative to the FoBMO axis. The mean PCT within each sector at six measurement locations (extending from 100 μm from the ASCO (left most column) to 1100 μm from the ASCO (right most column) are shown (upper row). The mean PCT of the top three thickest sectors at each measurement distance are bold black. The mean PCT of the top three thinnest sectors are bold blue. The thinnest sectors are significantly thinner than the thickest sectors when they are accompanied by a number sign symbol (see below). The rate of PCT change with age in each sector (μm/y), after adjusting for axial length, ASCO area, IOP, ethnicity, and sex (middle row). The sectors with the top three slowest rates of change are bold black. The sectors with the top three fastest rates of change are bold blue. The rates of change of the fastest sectors are significantly faster than the slowest sectors when they are accompanied by a number sign symbol (legend below). The rate of %PCT change with age in each sector after adjusting for the same covariates (lower row). The sectors with the three lowest rates of %PCT change are bold black. The sectors with the three fastest rates of %PCT change are shown in bold blue. The fastest sectors are significantly faster than the slowest sectors when accompanied by a number sign symbol. Significant differences, by a general estimation equation model are depicted by ###P < 0.001; ##P < 0.01; and #P < 0.05, respectively.

