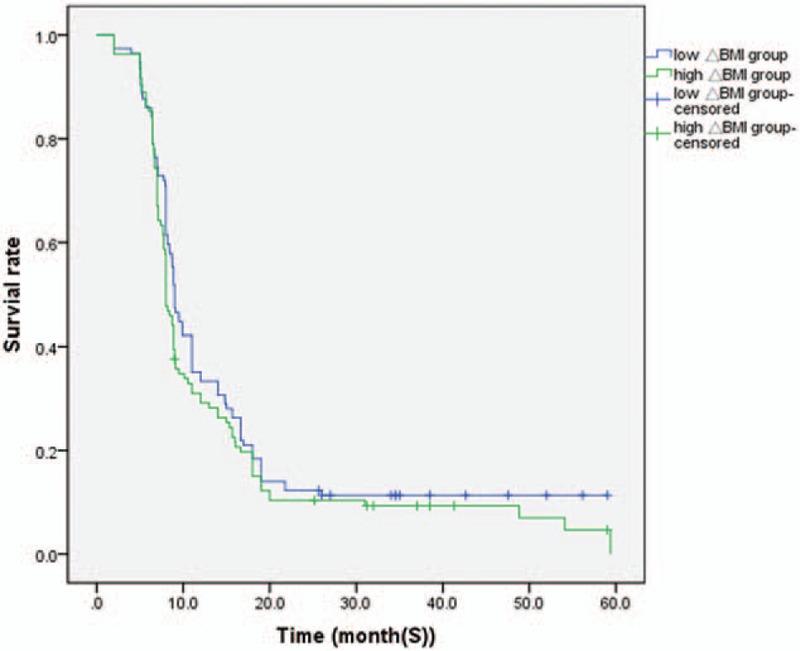
Figure 1.

Kaplan-Meier survival analysis according to ΔBMI status (n = 224). The y-axis indicates the percentage of patients and x-axis depicts their survival in months. The green line represents the patients with low ΔBMI expression, who did not show a trend of worse survival than those with high ΔBMI, indicated by the blue line. The median progression-free survival of high ΔBMI group and low ΔBMI group were (8.0 ± 0.35), (9.0 ± 0.59) months, respectively (P > .05). ΔBMI = body mass index change.
