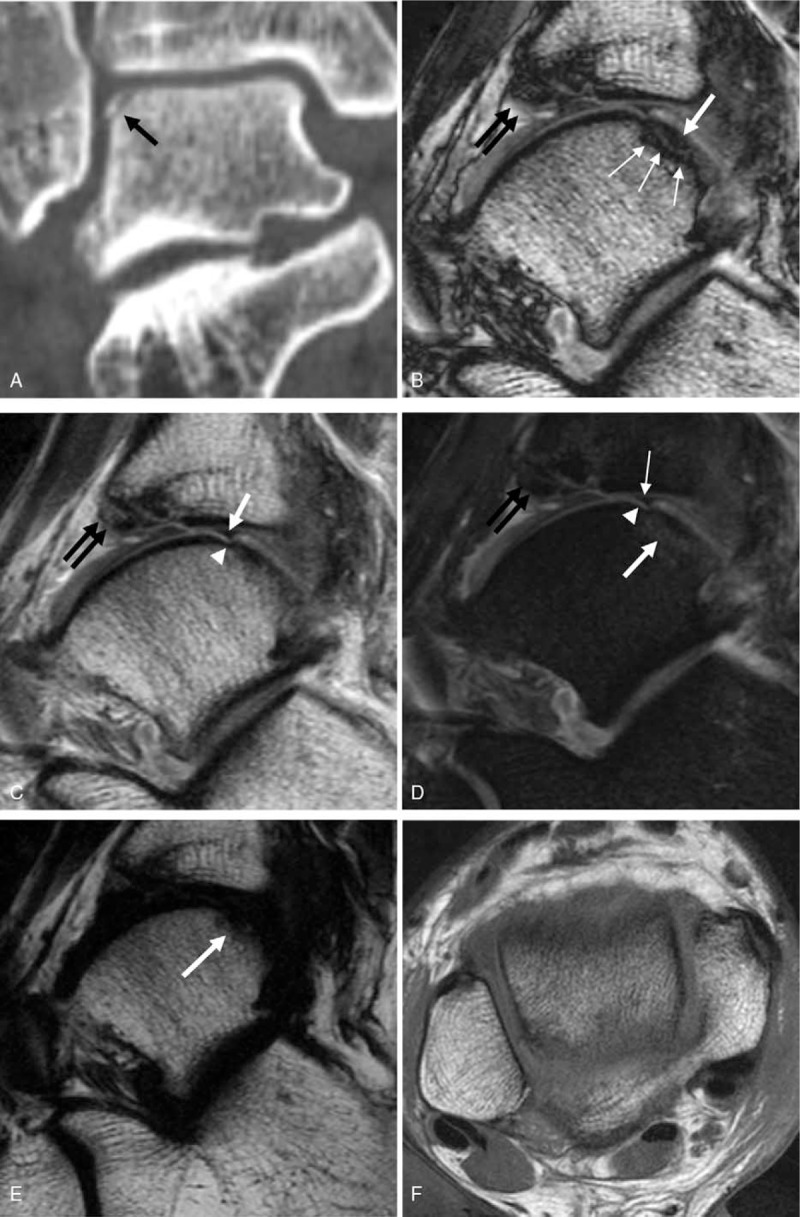
Figure 2.

In lower leg CT (A), the chip fracture of the lateral talar dome is well depicted (arrow). There is no significant displacement of the fracture fragment. (B) Sagittal opposed-phase imaging from T2-weighted mDixon imaging demonstrates a wafer-shaped chip fracture at the corresponding area noted from the CT (white thick arrow). The fracture line is clearly delineated by a linear thick dark line caused by black boundary artifact (white thin arrows). (C) Sagittal in-phase imaging from T2-weighted mDixon technique shows a focal wedge-shaped cartilage defect at the talar dome (white arrow). There is subtle cortical irregularity at subjacent cortex (arrowhead). The fracture fragment is not delineated. (D) Sagittal water-only sequence from T2-weighted mDixon imaging shows a fuzzy linear bone marrow edema (white thick arrow). The cartilage defect (white thin arrow) and cortical irregularity (arrow head) are noted. (E) Sagittal fat-only imaging from T2-weighted mDixon imaging demonstrates a focal dark signal alteration at the subcortical area (arrow) which cannot be distinguished from the adjacent cortex or physiologic effusion. (F) In axial T1-weighted image, the fracture line is not clearly depicted. Note the displaced fracture fragment from the anterior tibial plafond is relatively clearly noted in B–D (black double arrows).
