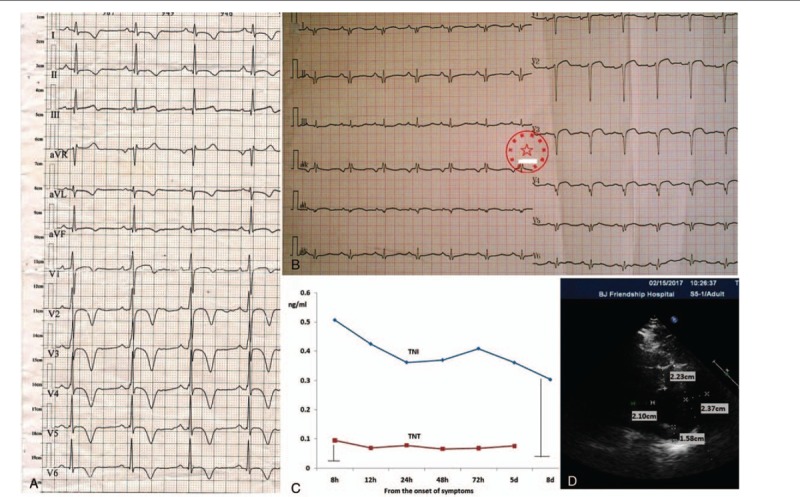
Figure 1.

Electrocardiogram, echocardiogram, and troponin: (A) the electrocardiogram showed significant T wave inversion (I, II, aVL, and V2–V6) in 2007, when the patient was 23 years old. (B) The electrocardiogram showed a significant decrease in the amplitude of the QRS voltages and significant, persistent ST-segment elevation in most of the leads in 2017. (C) His TNI and TNT levels were persistently elevated in serial measurements. (D) The echocardiogram showed marked LV wall thickening, especially at the LV apical region, that was >2.37 cm. LV = left ventricular, TNI = troponin I, TNT = troponin T.
