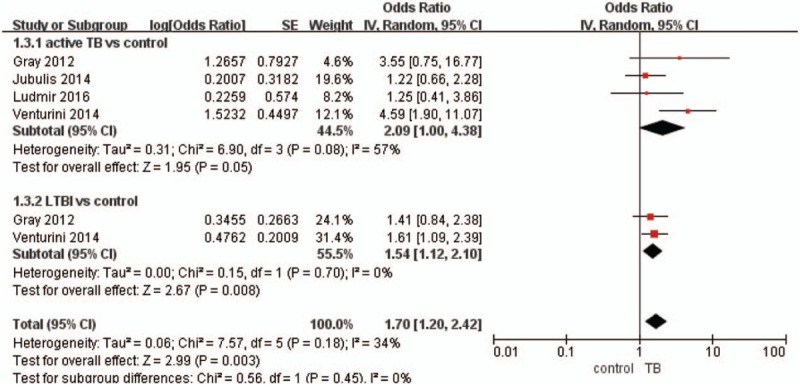
Figure 3.

Forest plot of pooled odds ratios for vitamin D deficiency in the active TB/LTBI and control groups. LTBI = latent TB infection, TB = tuberculosis.

Forest plot of pooled odds ratios for vitamin D deficiency in the active TB/LTBI and control groups. LTBI = latent TB infection, TB = tuberculosis.