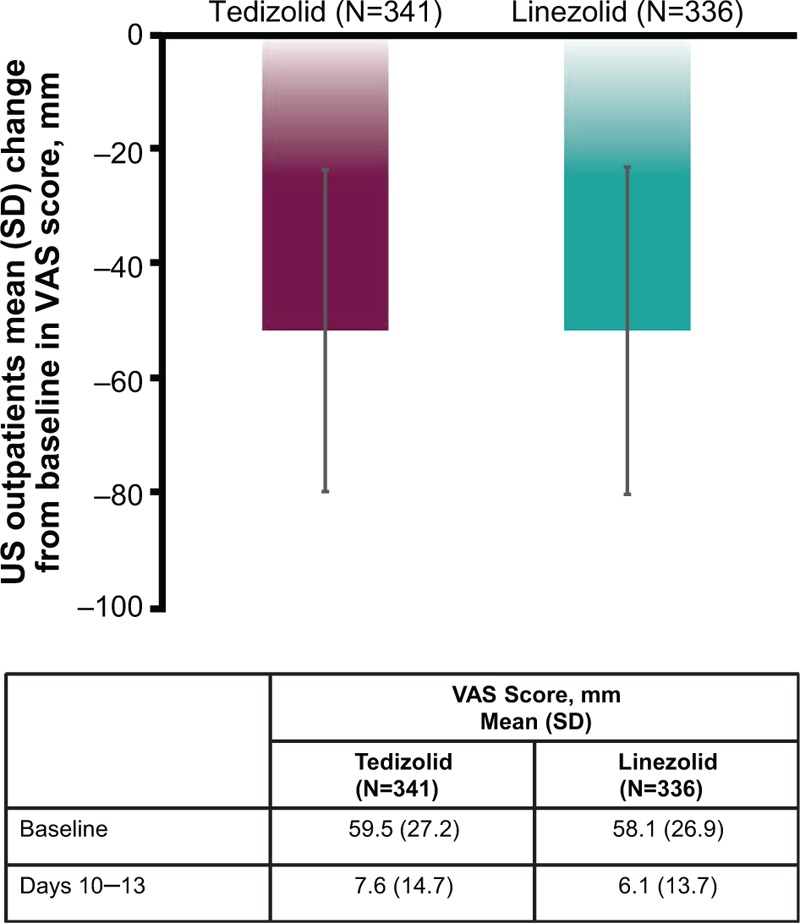
Figure 2.

VAS scores in US-based outpatients at baseline and at days 10 to 13 (ITT population). ITT = intent-to-treat; SD = standard deviation; VAS = visual analog scale.

VAS scores in US-based outpatients at baseline and at days 10 to 13 (ITT population). ITT = intent-to-treat; SD = standard deviation; VAS = visual analog scale.