Figure 1.

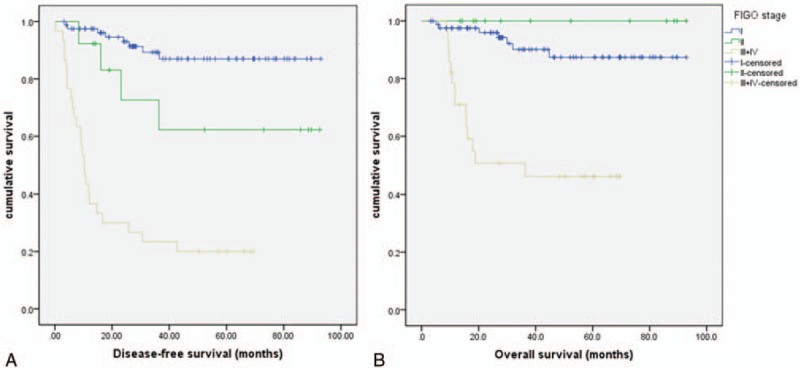
Kaplan-Meier survival analysis stratified by stage. (A) There is significant difference in disease-free survival (A, P < .05) and overall survival (B, P < .05) among FIGO stages I, II, and III/IV (P < .05; P < .05).

Kaplan-Meier survival analysis stratified by stage. (A) There is significant difference in disease-free survival (A, P < .05) and overall survival (B, P < .05) among FIGO stages I, II, and III/IV (P < .05; P < .05).