
Figure 1.
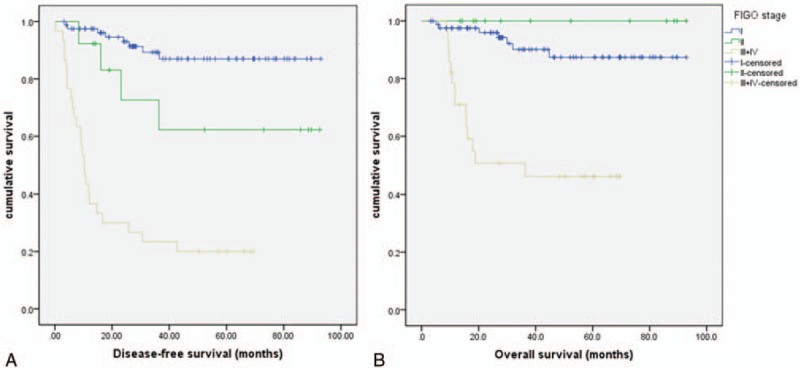
Kaplan-Meier survival analysis stratified by stage. (A) There is significant difference in disease-free survival (A, P < .05) and overall survival (B, P < .05) among FIGO stages I, II, and III/IV (P < .05; P < .05).
Official websites use .gov
A
.gov website belongs to an official
government organization in the United States.
Secure .gov websites use HTTPS
A lock (
) or https:// means you've safely
connected to the .gov website. Share sensitive
information only on official, secure websites.
Kaplan-Meier survival analysis stratified by stage. (A) There is significant difference in disease-free survival (A, P < .05) and overall survival (B, P < .05) among FIGO stages I, II, and III/IV (P < .05; P < .05).