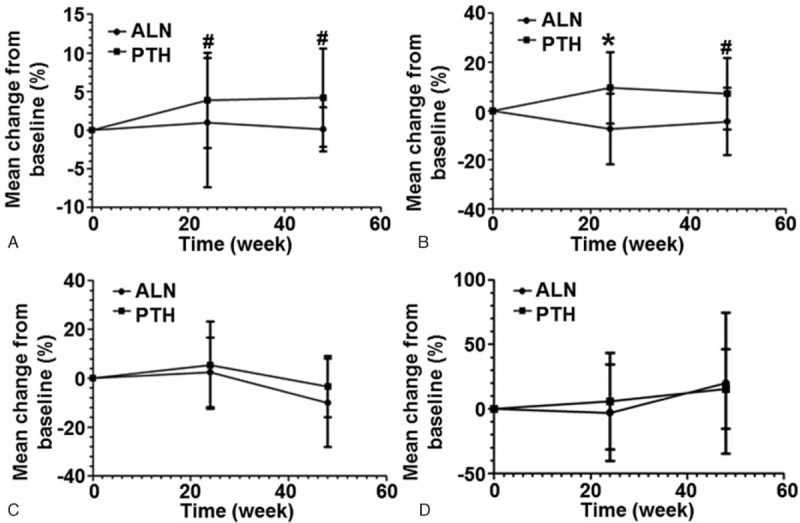
Figure 4.

Changes of levels of (A) calcium, (B) phosphorus, (C) total cholesterol, and (D) triglyceride before and after treatment. The percentages of changes from baseline were measured before treatment and at week 24 and week 48 after treatment. #P < .05 and ∗P < .001 between recombinant human parathyroid hormone (PTH) group and alendronate (ALN) group at the same time point. ALN = alendronate, PTH = parathyroid hormone.
