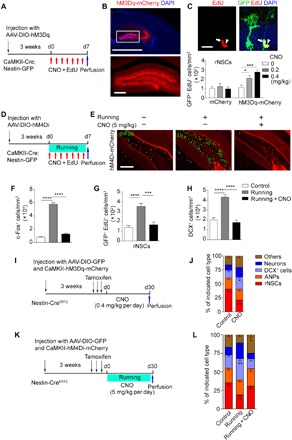
Fig. 2. Dentate GCs excited by chemogenetic approach promotes rNSC activation.

(A) Experimental paradigm for in vivo chemogenetic stimulation. (B) Composite images showing infected neurons in DG regions. Scale bars, 2000 μm (top) and 200 μm (bottom). (C) Composite confocal images showing EdU-incorporated rNSCs (arrows) and ANPs (arrowheads). Scale bar, 25 μm. Density of EdU-incorporated rNSCs in the DG after CNO treatment at concentrations of 0, 0.2 and 0.4 mg/kg. mCherry: 77, 86, and 79 EdU+ rNSCs of 56, 54, and 56 brain slices in the 0, 0.2, and 0.4 mg/kg group were counted, respectively; n = 7 mice for each group; hM3Dq-mCherry: 88, 217, and 256 EdU+ rNSCs of 49, 53, and 56 brain slices in the 0, 0.2, and 0.4 mg/kg group were counted, respectively; n = 7, 8, and 8 mice (bottom). (D) Experimental paradigm for in vivo chemogenetic inhibition by AAV-DIO-hM4Di-mCherry virus injection in CaMKII-Cre; Nestin-GFP mice under voluntary running. (E) Images of c-Fos+ cells in the DG following chemogenetic inhibition under voluntary running trials. Scale bar, 200 μm. (F to H) Quantification of c-Fos+ cells and EdU-incorporated rNSCs and DCX+ cells in the DG of the control and running group following chemogenetic inhibition under voluntary running trials. Control, Running, and Running + CNO groups: 1488, 8574, and 1083 c-Fos+ cells; 87, 225, and 97 EdU+ rNSCs; and 3597, 9086, and 4023 DCX+ cells of 49, 55, and 58 brain slices were counted, respectively; n = 7, 8, and 8 mice. (I) Scheme depicting the experimental procedure for 30-day lineage tracing under GC excitation. (J) The graph shows the proportion of the different cell types in the niche quantified of all GFP+ cells of Nestin-CreERT2 mice. Control group: 4021 GFP+ cells of 51 brain slices were counted; n = 9 mice; CNO group: 5781 GFP+ cells of 49 brain slices were counted; n = 8 mice. (K) Scheme depicting the experimental procedure for 30-day lineage tracing in running mice under GC inhibition. (L) The graph shows the proportion of the different cell types in the niche quantified of all GFP+ cells of Nestin-CreERT2 mice. Control group: 2877 GFP+ cells of 44 brain slices were counted; n = 7 mice; Running group: 4016 GFP+ cells of 45 brain slices were counted; n = 7 mice; Running + CNO group: 2511 GFP+ cells of 48 brain slices were counted; n = 6 mice. Results are presented as means ± SEM. *P < 0.05; **P < 0.01; ***P < 0.001; ****P < 0.0001.
