
Fig. 4. Ephrin-B3 is involved in the shift from quiescent rNSCs to activated NSCs.
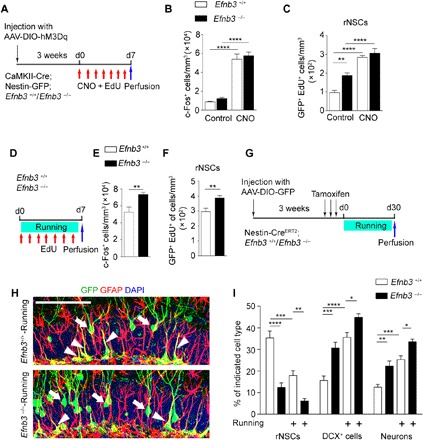
(A) Experimental paradigm for chemogenetic stimulation by AAV-DIO-hM3Dq-mCherry injection in the DG of CaMKII-Cre; Nestin-GFP; Efnb3−/−mice. (B and C) Quantification of the number of c-Fos+ and EdU-incorporated rNSCs after hM3Dq stimulation. In the Efnb3+/+, Efnb3−/−, Efnb3+/+ + CNO, and Efnb3−/− + CNO groups, 1325, 2314, 6903, and 6721 c-Fos+ cells and 65, 176, 189, and 203 EdU+ rNSCs of 43, 39, 44, and 49 brain slices were counted, respectively; n = 6, 6, 7, and 6 mice. (D) Experimental paradigm for the roles of ephrin-B3 in rNSC activation under voluntary running. (E and F) Quantification of the number of c-Fos+ and EdU-incorporated rNSCs in Efnb3 +/+ and Efnb3−/− mice after voluntary running. In the Efnb3+/+ and Efnb3−/− running groups, 4627 and 6019 c-Fos+ cells and 126 and 167 EdU+ rNSCs of 30 and 31brain slices were counted, respectively; n = 4 mice for each group. (G) Scheme depicting the experimental procedure for lineage tracing in running Efnb3−/− mice. (H) Composite images showing infected GFP+ cells in the DG regions of Efnb3+/+-Running and Efnb3−/−-Running mice. Scale bar, 100 μm. (I) The graph shows the proportion of the different cell types in the niche quantified of all GFP+ cells of Nestin-CreERT2 mice. Control group: 3024 GFP+ cells of 38 brain slices were counted; n = 5 mice; Efnb3−/− group: 3689 GFP+ cells of 43 brain slices were counted; n = 7 mice; Efnb3+/+-Running group: 5019 GFP+ cells of 55 brain slices were counted; n = 8 mice; Efnb3−/−-Running group: 4716 GFP+ cells of 49 brain slices were counted; n = 8 mice. Results are presented as means ± SEM. *P < 0.05; **P < 0.01; ***P < 0.001; ****P < 0.0001.