
Fig. 4. Glymphatic tracer influx is inversely correlated with heart rate.
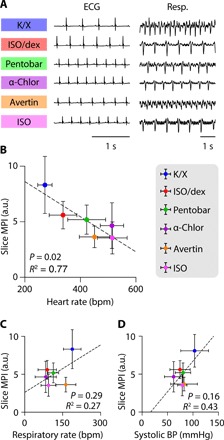
(A) Representative traces of electrocardiogram and respiratory measurements for the six anesthetic regimens. (B to D) Scatterplots showing the correlation between MPI in coronal slices and heart rate (B), respiratory rate (C), and systolic blood pressure (BP) (D) across all anesthetic groups. Each dot represents the group mean (whiskers, SD). Correlations were calculated using group means; P values and R2 values are displayed for each correlation. K/X, n = 36 animals for influx and 9 animals for cardiopulmonary measurements; ISO supplemented with dex, n = 14 animals for influx and 7 animals for cardiopulmonary measurements (CPMs); pentobarbital, n = 27 animals for influx and 8 animals for CPMs; tribromoethanol, n = 27 animals for influx and 5 animals for CPMs; α-chloralose, n = 20 animals for influx and 8 animals for CPMs; and ISO, n = 23 animals for influx and 7 animals for CPMs.