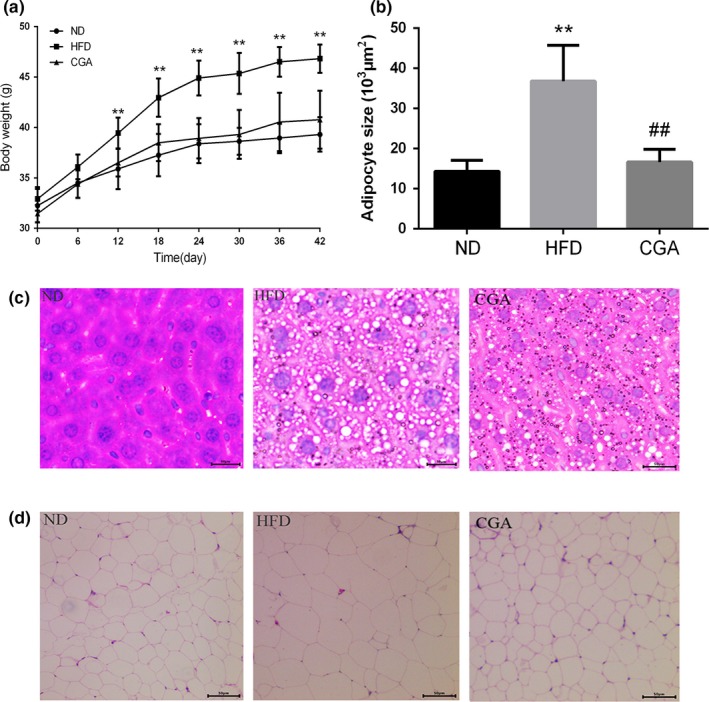
Figure 1.

Effects of chlorogenic acid on body weight increase of mice during the 6‐week study period (a). The sizes of adipocytes in epididymal adipose tissue (b). Liver morphology (c) and epididymal WAT morphology (d) in different groups. HE staining (×200). Significant differences between HFD versus ND are indicated: *p < 0.05; **p < 0.01. Significant differences between CGA versus HFD are indicated: # p < 0.05; ## p < 0.01
