Figure 3.

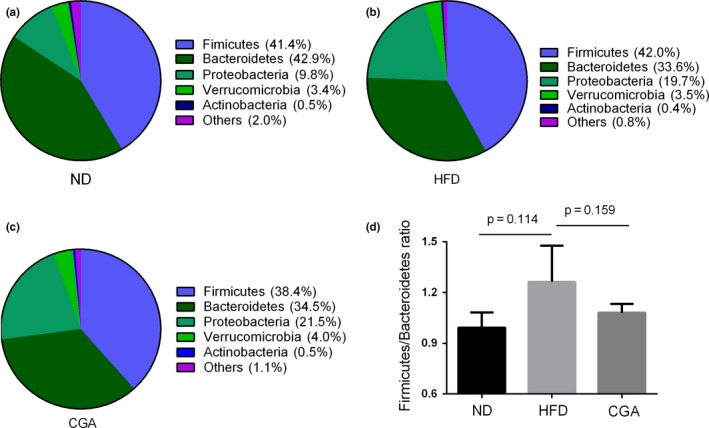
Distribution of the gut microbiota composition. ND group (a); HFD group (b); CGA group (c) at the phylum level and the ratio of Firmicutes to Bacteroidetes at different groups (d)

Distribution of the gut microbiota composition. ND group (a); HFD group (b); CGA group (c) at the phylum level and the ratio of Firmicutes to Bacteroidetes at different groups (d)