Figure 1.

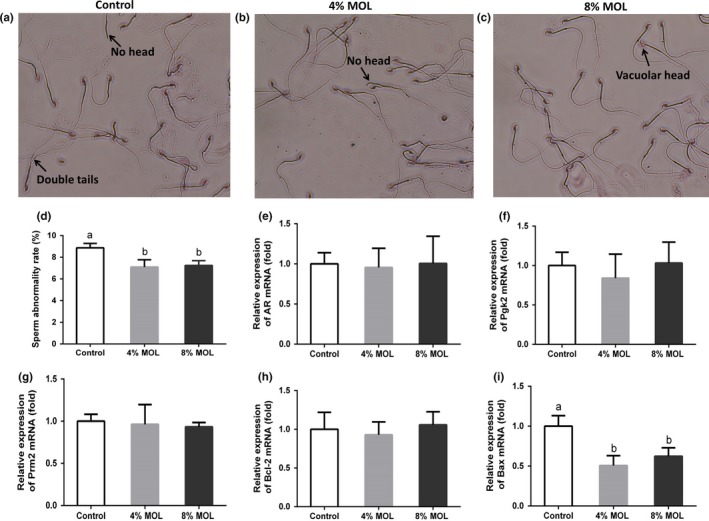
Microscopic observation (400×) of sperm morphology for control (a), 4% MOL (b) and 8% MOL (c). The sperm abnormality rates of male mice (d). Relative mRNA levels of AR (e), Pgk2 (f), Prm2 (g),Bcl‐2 (h), and Bax (i) by using quantitative PCR in testis tissue of male mice. Data are presented as mean ± SEM, n = 8. Results are normalized to β‐actin. Different superscripts “a”/“b” represent significant differences between groups (p < 0.05). Control: diet without MOL, 4% MOL: diet supplemented with 4% MOL, and 8% MOL: diet supplemented with 8% MOL
