Figure 1.

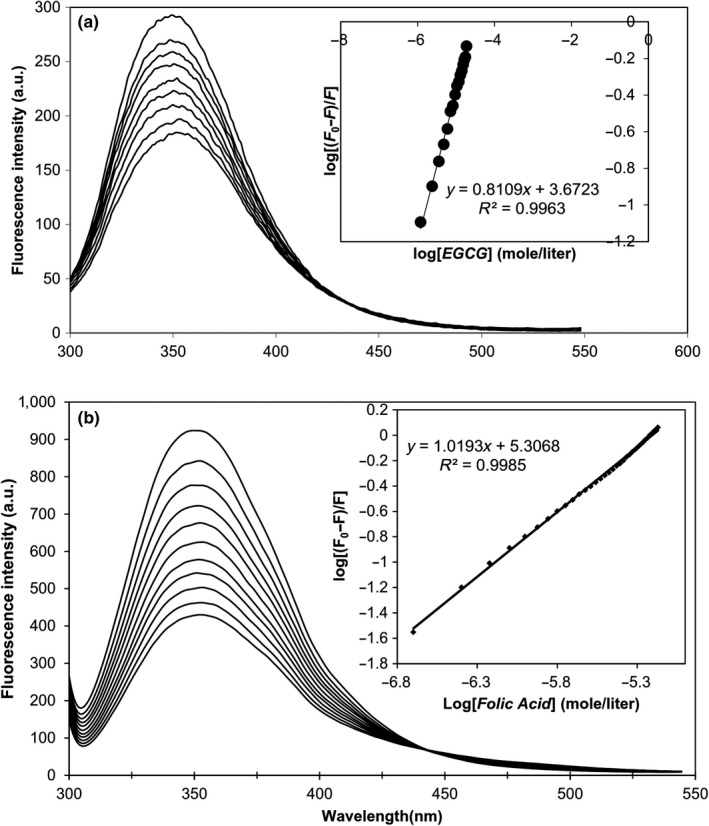
The fluorescence emission spectra of sodium caseinate (5 μM, pH 7.4) excited at 287 nm after successive injections of (a) EGCG and (b) FA (The inset shows the analysis of binding parameters)

The fluorescence emission spectra of sodium caseinate (5 μM, pH 7.4) excited at 287 nm after successive injections of (a) EGCG and (b) FA (The inset shows the analysis of binding parameters)