Figure 2.

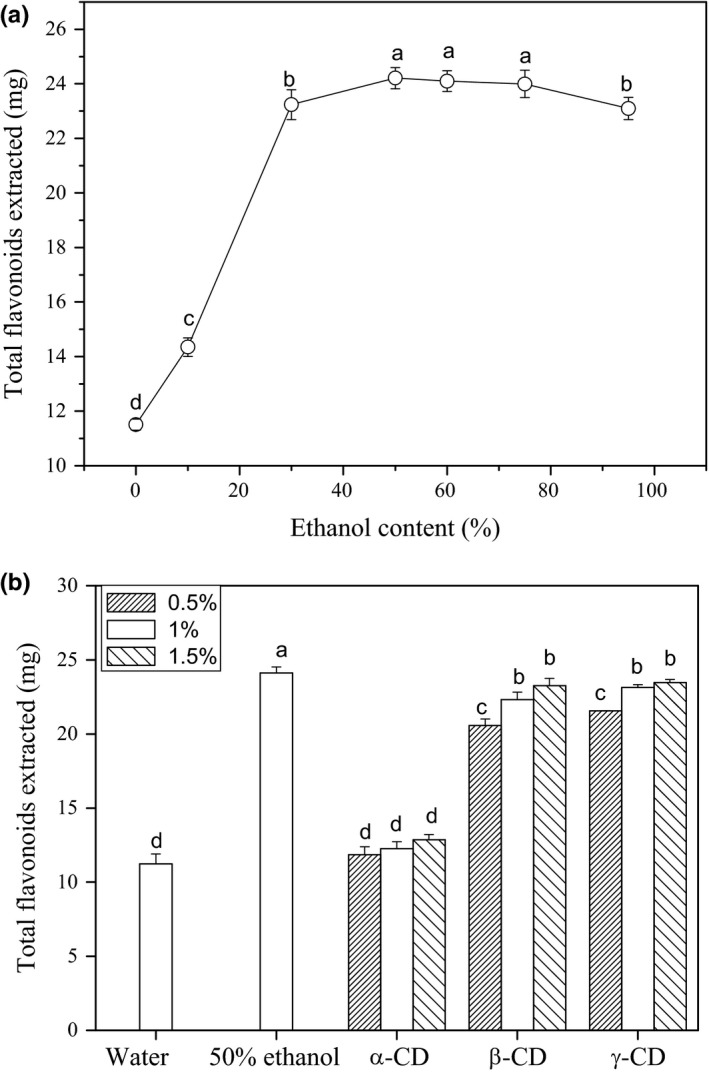
The total flavonoids extraction efficient comparison between different ethanol solvents (a) and CDs aqueous solution (b). Different letter in the graph means significant difference (ANOVA, p < 0.05)

The total flavonoids extraction efficient comparison between different ethanol solvents (a) and CDs aqueous solution (b). Different letter in the graph means significant difference (ANOVA, p < 0.05)