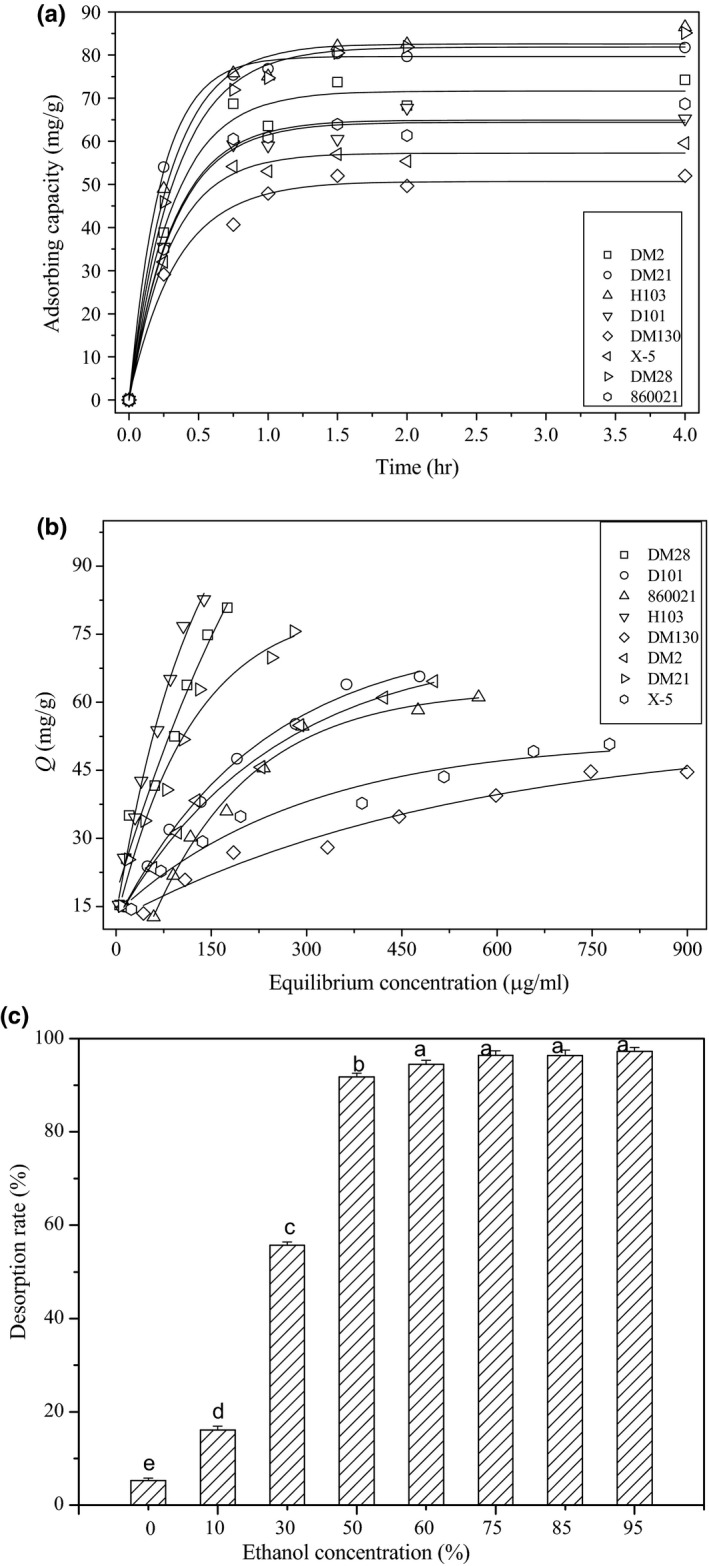
Figure 3.

The kinetic adsorption results (a) and equilibrium adsorption isotherms (b) of the eight resins at 25°C; The desorption efficiency of different ethanol concentration (c). Different letter in the graph means significant difference (ANOVA, p < 0.05)
