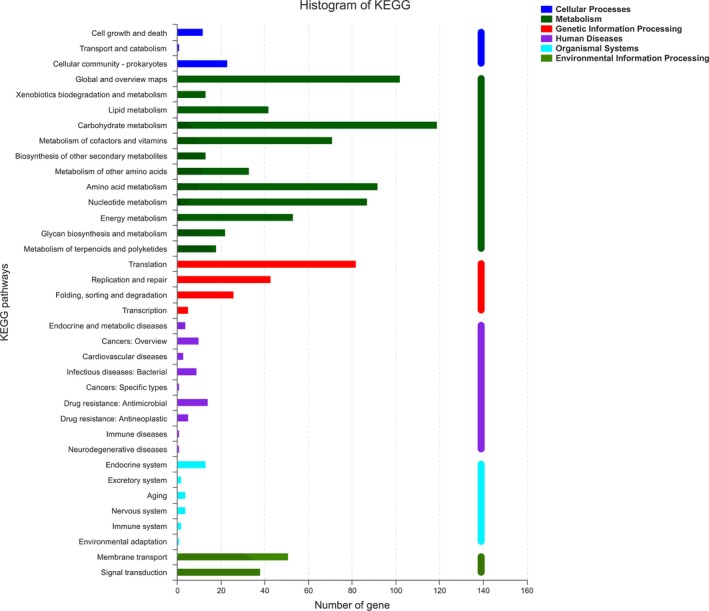
Figure 3.

Histogram of KEGG. Histogram presents the number of genes involved in KEGG pathway. The colors indicates different systems, mazarine refers to cellular processes, bottle green depicted metabolism, red illustrates genetic information processing, purple denotes human diseases, blue highlights organismal system, and reseda shows environmental information processing
