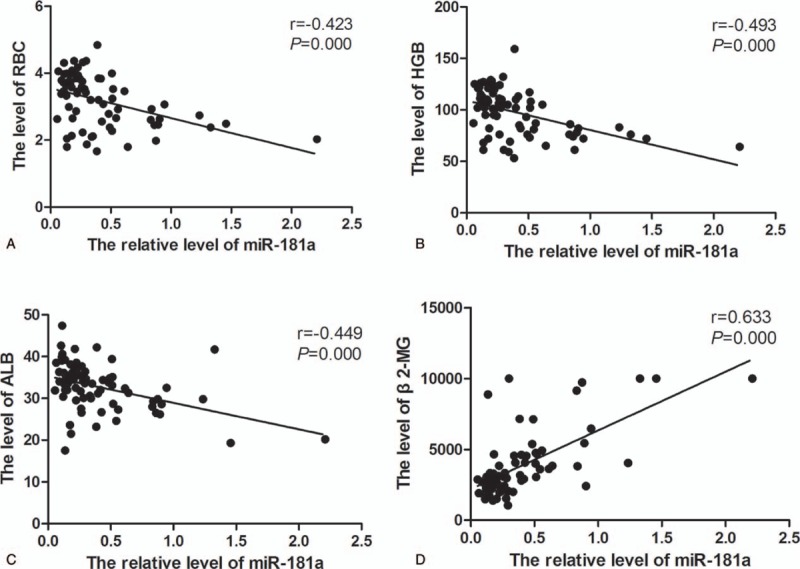
Figure 2.

Correlation of miR-181a with tumor burden indicators. The spearman correlation analysis was used. (A) Correlation of miR-181a with RBC. (B) Correlation of miR-181a with HGB. (C) Correlation of miR-181a with ALB. (D) Correlation of miR-181a with β2-MG. ALB = albumin, HGB = hemoglobin, MM = multiple myeloma, RBC = red blood cell.
